This is another in a series of pictures showing what this year's blue wave looks like. Each congressional district has equal size in these cartograms. So far, I've done most everything from Illinois to Maine.
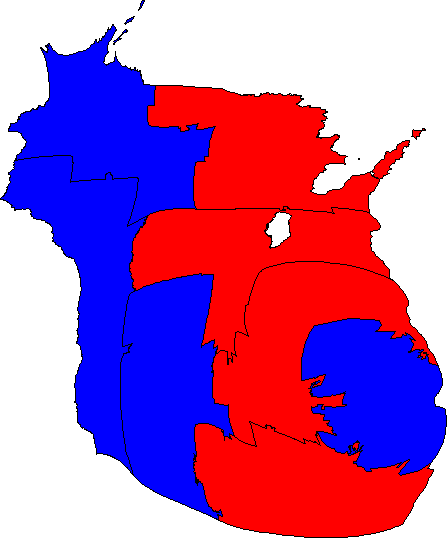
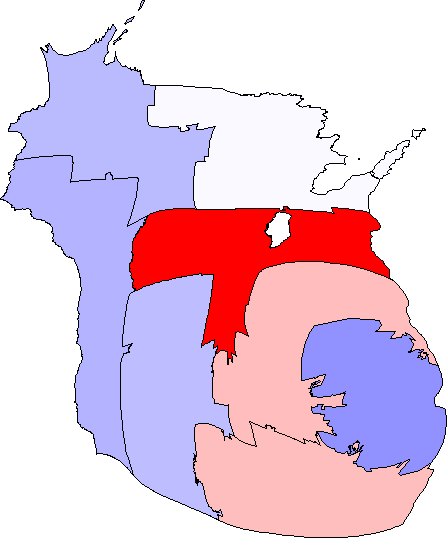
Here's how things stood before the 2006 election. (Click the thumbnails for larger images.)
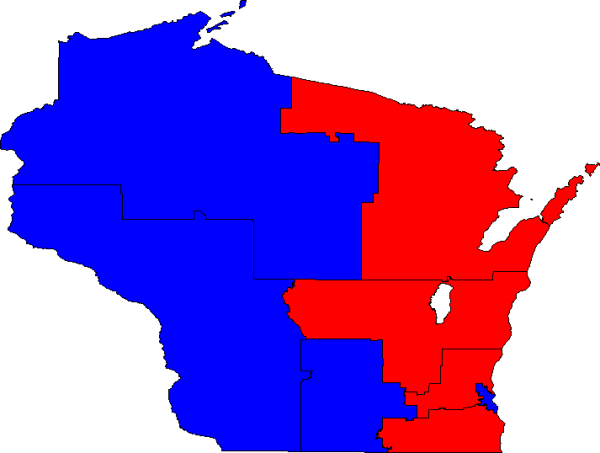
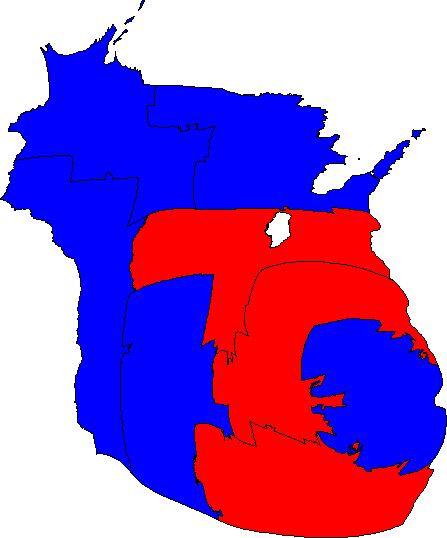
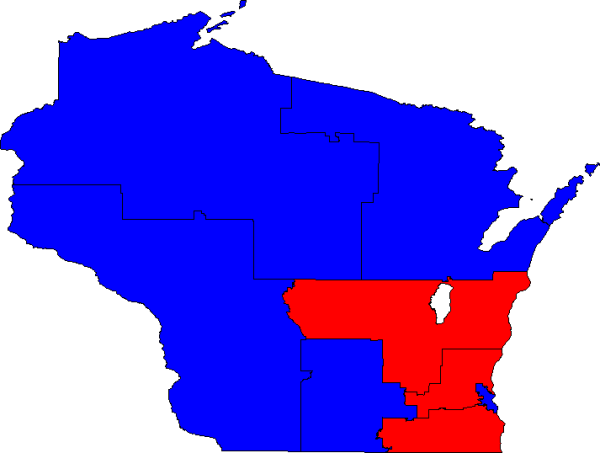
Here's how things came out on Election Night. Green Bay may be home to the hated Packers, but at least they elected a Democrat.
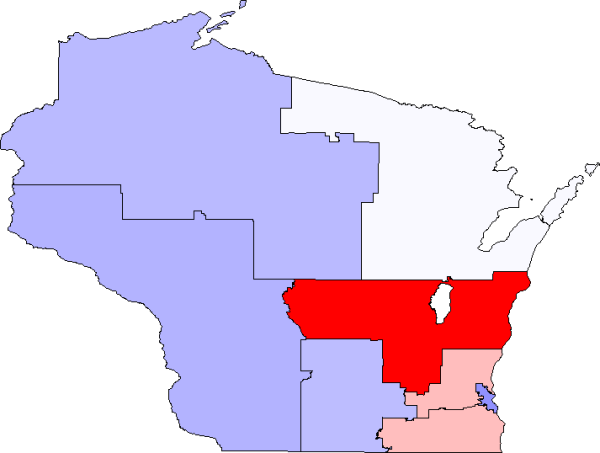
Next are maps showing the margin of victory.
Finally, here's a map showing the margin-of-victory change from 2004 to 2006.
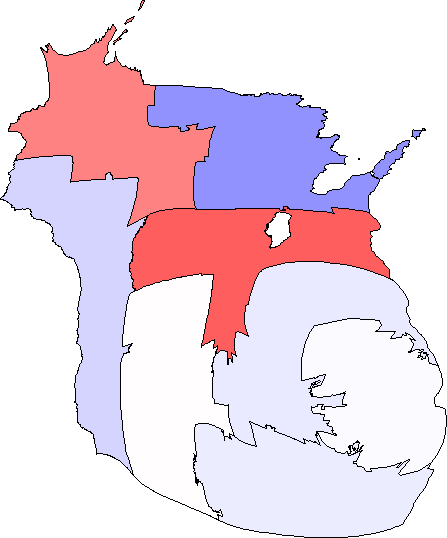
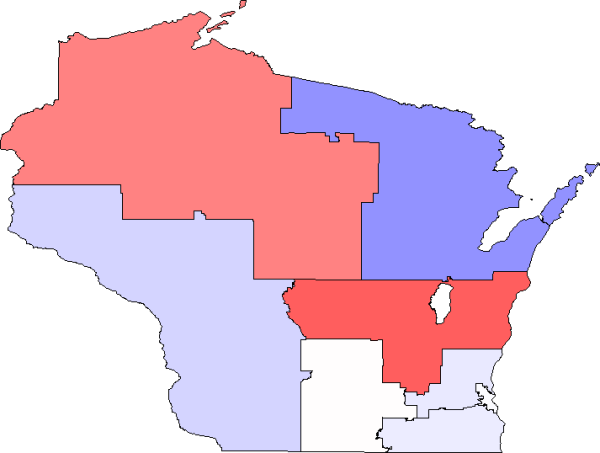
We'll be on defense in the 8th in 2008. Otherwise, I can hardly imagine any seats flipping.
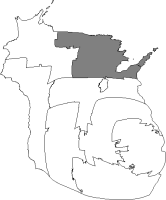
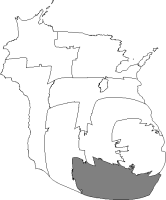
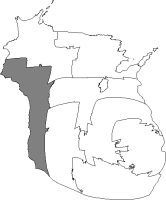
Here are thumbnails of the districts. My favorite ordinary maps of congressional districts are from the Census Bureau and the Interior Department.
WI-01 (Milwaukee suburbs, Racine, Kenosha, Chicago suburbs), Ryan (R) defeats Thomas (D) 63-37:
WI-02 (Madison), Baldwin (D) defeats Magnum (R) 63-37:
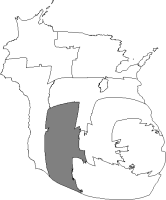
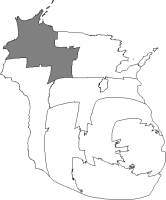
WI-03 (Eau Claire), Kind (D) defeats Nelson (R) 65-35:
WI-04 (Milwaukee), Moore (D) defeats Rivera (R) 72-28:
WI-05 (Milwaukee suburbs), Sensenbrenner (R) defeats Kennedy (D) 62-36:
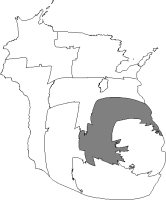
WI-06 (Oshkosh), Petri (R) unopposed:
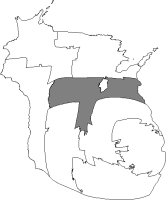
WI-07 (Duluth suburbs), Obey (D) defeats Reid (R) 62-35:
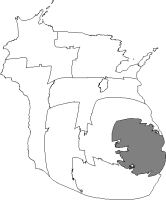
WI-08 (Appleton, Green Bay), Kagen (D) defeats Gard (R) 51-49 for open seat held by Green (R):