So, rather than trying to do things subjectively as I did last time around, I'm going to take a slightly different tact this time around. We've had 26 states participate in DNC-sanctioned contests so far. There is a whole wealth of data in those states; we know what share of the primary or caucus vote that Hillary Clinton and Barack Obama got, and we can evaluate those states according to a whole series of demographic and other characteristics. For example:
Does Obama really do better in caucus states? If so, how much of an advantage does this give him?
Does Obama really do better with highly-educated voters? Does Hillary really do better with downscale voters?
What makes a Hillary state a Hillary state, and an Obama state an Obama state? Why did Obama win Kansas by an enormous margin, but lose Oklahoma by an enormous margin?
Who is likely to win Wisconsin?
These are some of the questions we can address.
The basic technique here is multiple regression analysis. I took a look at a whole number of independent variables, and tried to gauge their effect on one dependent variable: Obama's two-way vote share. By "two-way vote share", I mean the proportion Obama got of the (Obama + Hillary) votes; essentially we're throwing the Edwards, Richardson, Biden, etc. votes out. So in New Hampshire, Obama's two-way vote share is 48.3%, and Hillary's is 51.7% -- much higher than their multi-way vote share.
I looked at pretty much every variable I could think of that we can quantify about a state and that might affect the Obama-Clinton vote share. It turns out that there are 8 or 10 that proved to be statistically significant enough for me to include them in my model. Those variables are:
- Caucus versus Primary. Obama does do better in caucus states -- a lot better. In fact, a caucus appears to be about 13 points better for him than a primary, all else being equal. By the way, the type of primary or caucus does not seem to matter. That is, Obama doesn't do any better in "open" primaries or caucuses. Perhaps this will change as he Republican race winds down, but it hasn't mattered so far.
- African-American population. No surprise: Obama benefits significantly from states with high African-American populations. Is he hurt in states with high Latino populations? More on that in a moment.
- Percentage of 18-29 voters. Obama benefits when young voters make up a relatively high fraction of the Democratic turnout. Again, this should not be surprising. However, it isn't quite so straightforward as it might seem, because with the exception of a couple of outliers like Alaska and Florida, there isn't that much variation in the underlying age distribution of the population from state to state. But, there is variation in the age distribution of the Democratic turnout from state to state. Utah and Idaho, for instance, are both relatively young states, but in Utah, young voters tend to be nearly as conservative as their parents, while in Idaho, they tend to be considerably more progressive. So, what I looked at was the percentage of John Kerry voters who fell into a given age range as determined from CNN exit polls in the 2004 election. This has proven to be a pretty good predictor of age-based turnout in the Democratic primaries so far.
- Percentage of adults with college degrees. Obama does better in states with a large number of college graduates. It is educational attainment, rather than income level, that appears to be the driving force behind Obama's "upscale" support. In fact, there is some weak evidence that Obama actually does a bit better in states with lower median household incomes, once we control for educational attainment (but, the effect was not quite statistically significant enough to make the final cut). Trust me -- I looked and looked for this one, analyzing variables such as household income, per capita income, home values, home ownership, unemployment rates, and union membership. The idea that Clinton does better with working class voters seems to be a myth; she does better with voters without college degrees, but not working class voters per se. To the extent any such effects exist, they appear to point in the opposite direction of the conventional wisdom.
- Fundraising. One extremely useful variable is fundraising power. These people are not only almost guaranteed to vote for you, but they're also your precinct captains, organizers, etc. Specifically, I looked at the total amount of campaign contributions that Obama and Clinton have received in a given state, divided by the number of votes that John Kerry got in that state in 2004 (e.g. a broad Democratic base). On average, the each candidate had raised about $1.00 per Kerry vote in FEC filings through the end of 2007, but the results vary significantly from state to state. In New York, for example, Hillary has raised $5.18 per Kerry voter, but just $0.03 per Kerry voter in North Dakota. Obama has less state-to-state variance in his numbers than Hillary does; whereas Hillary cleans up in "liberal establishment" states like New York and California, Obama generally does better than Hillary in smaller states.
Now we start to get into a few of the especially interesting ones...
- Percentage of Southern Baptists. It's clear that Obama has some issues with Southern whites, but I was having trouble coming up with a variable that adequately accounted for this. It doesn't suffice to use a "one size fits all" variable for Southerness, because some states are more Southern than others. For example, Virginia is usually regarded as a Southern state, but it is not nearly as Southern as something like Mississippi. Is Florida a Southern state? Geographically, yes. Culturally, only in certainly places. Eventually, I came across data on the percentage of Southern Baptists in each state; this ranges from virtually zero in many places, up to 33.8% in Mississippi. And this variable proved to have a lot of explanatory power; Obama does much worse, all else being equal, in states with a lot of Southern Baptists. Now, "all else being equal" is a key term, because states with a lot of Southern Baptists tend also to have a lot of black voters. But there are some exceptions. Oklahoma has a lot of Southern Baptists, but not so many black voters, and Obama did very poorly there. On the other hand, a state like Maryland has a lot of black voters, but very few Southern Baptists. Obama is likely to do quite well in Maryland.
- John Kerry vote share, 2004. Even controlling for all these other variables, Hillary does better in blue states, and Obama does better in red states. Again, the best way I can explain this is that Hillary excels in states with strong, liberal establishments. However...
- Percentage of Democratic voters who self-identify as Liberal. Obama gains ground in states where a high percentage of the Democratic base identifies as "liberal". This data was gathered from the CNN exit polls that I mentioned above, based on a sample of Kerry voters only. Obama's very best states are states that overall are "red", but where the Democrats that are in the state are very progressive. Idaho is one such state, for example; 42% of Kerry voters in 2004 identified as liberal (the nationwide average is 35%), even though Bush beat him by more than 2:1.
- Percentage of naturalized citizens, e.g. immigrants. Surprisingly, I did not find that Obama performed worse in states with large Latino populations. Keep in mind that the difference in Obama's vote share with white voters and Latinos is no longer all that great; he's getting about 45% of the former, and 35% of the latter, and even these differences can be explained by the other variables in my model (for example, a relatively small percentage of Latino voters have college degrees). However, I did find that Obama performed slightly worse in states with a higher percentage of foreign-born, but now naturalized citizens. This distinction is important, because neither the Latino population nor the Asian population are monolithic. New Mexico, for example, has a huge number of Hispanics, but most of them have been here for generations. This helps to explain how Obama could virtually tie Hillary in New Mexico, in spite of its population being more than 40% Hispanic. New Jersey, on the other hand, has a rapidly-growing Latino population, and it consists mostly of recent immigrants. So it is one's immigration experience, and not one's race, that appears to account for Hillary's stronger support with Hispanic and Asian voters. A zero-gen Hispanic voter is somewhat more likely to vote for Hillary -- and perhaps that is intuitive, because many of them either came to this country or became citizens when Bill Clinton was in power. However, I would guess that native-born Hispanics vote for Obama at nearly the same rates as white voters do, accounting for their other demographic characteristics.
Collectively, these variables explain about 95% of the voting breakdown in the states that have gone to the polls thus far, and predicted Obama's actual vote share within an average of two points.
Predicted and Actual Obama vote share
State	Expect	Actual	Error
AK	72.9	74.6	1.6
AL	56.9	57.3	0.4
AR	28.8	27.9	-0.9
AZ	41.3	45.5	4.2
CA	41.2	44.8	3.7
CO	66.4	66.9	0.6
CT	53.6	52.0	-1.5
DE	57.1	55.6	-1.5
GA	68.5	68.1	-0.4
IA	54.7	56.1	1.3
ID	83.2	81.0	-2.3
IL	66.4	66.3	-0.1
KS	72.3	74.1	1.8
MA	45.9	42.0	-3.9
MN	65.9	67.5	1.6
MO	49.8	50.6	0.8
ND	64.3	62.6	-1.7
NH	45.9	48.3	2.4
NJ	50.1	44.9	-5.1
NM	49.1	49.9	0.9
NV	50.9	47.1	-3.8
NY	37.9	41.0	3.1
OK	38.7	36.3	-2.4
SC	63.4	67.6	4.2
TN	45.4	43.0	-2.4
UT	59.6	59.1	-0.5

FL	46.7	39.9	-6.8
I did not include Florida in my model because nobody had a chance to campaign there, but look at what happens when we do -- Florida is the biggest outlier. Specifically, the model implies that Obama would have gained 6-7 points, and Hillary lost 6-7 points, if candidates had been allowed to campaign in Florida, for a net swing of 12-14 points. The ability to campaign works to Obama's benefit.
So what does the model predict for the rest of the February states? You can see the results below, but it's important to keep one thing mind: these predictions suggest what might happen at the end of an active campaign. Obama campaigned in each of the states that was used to establish the model, and that's one reason why the results ended up as they did. These results are not predictions of what polls will look like in given states, before the campaign has concluded and voters have actually gone to the polls.
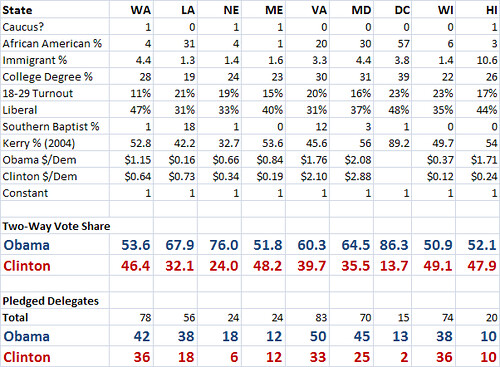
Although Obama hits at least 50% in each state, several should be considered too close to call, particuarly Maine and Wisconsin. Obama will need to run a good campaign to ensure he wins these states (and since Maine is voting tomorrow, he had better get to work). Washington is another state he could lose, in large part because its Democratic electorate is quite old, but we should be seeing those results momentarily. The model also thinks that Hawaii could be close, although frankly I think it's out to lunch on that one, since it's hard to account for "home state" effects. If this prediction came true, Obama would pick up a net of 80-100 delegates in the rest of the February states.
At this point, I'm going to wait for a couple of results to come in before issuing predictions for Texas and Ohio, but at this stage the model has Hillary winning Texas by about 10 points, and Obama winning Ohio by about 10 points. One way to look at Ohio is that it's basically Missouri but with fewer Southern Baptists, so if Obama won Missouri he should be able to win Ohio too. But since he does not have the strong surrogates in Ohio that he does in Missouri, it would probably require a pitch-perfect campaign for him to accomplish that.
