crossposted at RRH
This diary has actually two purposes. First of all I spent the last one or two days drawing several iterations of the New Mexico map which I find very interesting both in the context of New Mexico politics and in the general debate on redistricting. That gave me the idea how I could maybe make the life of mappers a bit easier-- for that part, just scroll past the maps.
Map 1--- Traditional Court-Style map
I started doing New Mexico as a quick way to calm down after a half-way completed Ohio map crashed on me without me having saved the data. Drawing NM court-style is about as easy as it gets.
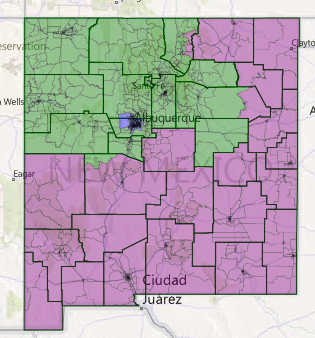
District 1-- Blue-- Martin Heinrich (retiring)
Albuquerque and Rio Rancho. It's as easy as that. They have the perfect population for a CD, so it's irresponsible not to keep them together.
This district voted 60-40 for Obama and 52.5-47.5 for the statewide Democratic slate in 2010, so it's Safe D in everything but a 2010-style wave, and even then it's Likely D.
It's currently 47.5% White VAP, 42.6% Hispanic VAP, 3.3% Native VAP and 6.6% Other VAP.
So far so good, this is where the real novelty in this diary comes in. I used a linear regression to analyse the Hispanic population growth from 2000 to 2010 by county-- that's fairly accurate. Leaving a few counties as a test set beside, it usually gets the 2010 VAP population within 1% right using 2000 adult population data.
I just use the same formula to project 2020 VAP data-- not 100% proper statistically, but it sure beats just adding 5% to the Hispanic population across the board.
Therefore, I project the 1st district's white VAP population to drop from 47.5% to 42.7%, the Native population to drop from 3.3% to 3.0%, and the Hispanic population to rise from 42.6% to 47.7%. Since the 'other' population basically didn't budge from 2000 to 2010, I just assume it'll stay that way.
District 2-- Green-- Ben Ray Luján
This basically keeps the Native areas in the West together and unites them with Hispanic areas in Northern NM. A very safe D seat at 63.5-36.5 Obama and 57.5-42.5 Dems in 2010.
Currently the adult population has a narrow White plurality at 39.3% to 38.6% Hispanics and 19.2% Natives. By 2020, it'll be a Hispanic plurality seat at 40.48%, with 39.9% Whites. The loser will be the Native areas, who are outgrown by the Hispanic and even the White areas and drop to 16.8%.
District 3--Purple--Steve Pearce.
The rest of the state and for now, and likely even later on, Safe R.
It voted 53.8-46.2% McCain and 58.2-41.8 for the Republican candidates in 2010.
That's not perfectly solid if Democrats get a wave in 2018 or so, but for now it should suffice to keep Pearce in office. Interestingly, it is currently the most Hispanic seat at 45.6%, with 49.1% for Whites. By 2020, that will have reversed. Hispanics will be just short of majority status at 49.9% (and remember, this is probabilistic. We're looking at standard errors of about +-2, which means that Hispanics have a chance of almost 50% to be the majority in 2020), while Whites will have dropped to 44.3%.
This map would probably lock in a 2-1 Dem delegation for the decade, and make everyone happy. It's also very clean, and the population deviation is pretty low (+20,-112,+20).
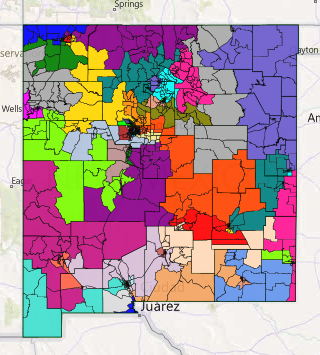
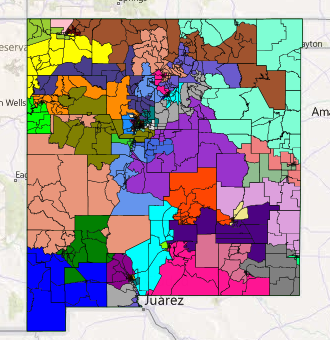
Map-2-- Constitutional GOP gerrymander
The next few maps divide NM into 86 districts with an ideal population of about 30,000 people. This should serve to illustrate how Gerrymandering can, even with smaller districts, can yield fairly dramatic differences in terms of results.
I won't do a write-up of every district, instead you get a couple of relatively self-explaining summary tables.
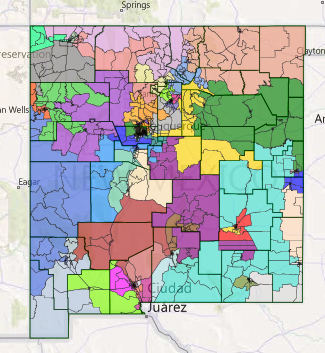
Statewide:
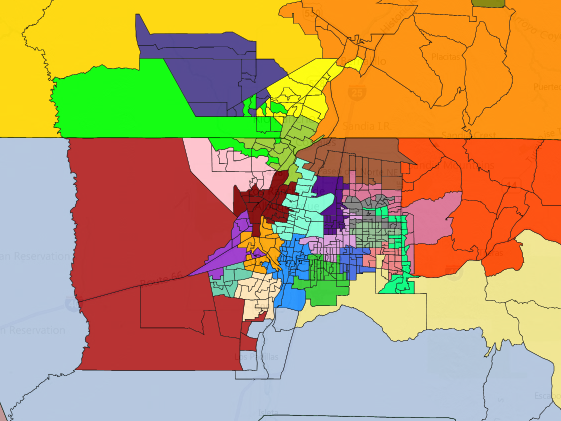
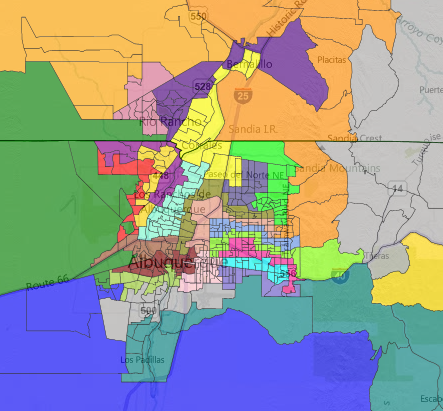
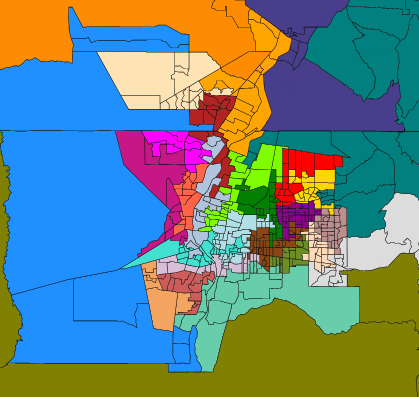
Albuquerque:
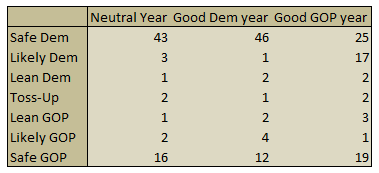
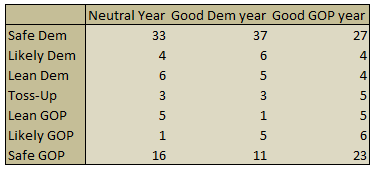
Political ratings:
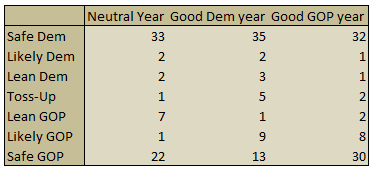
I probably should explain how I arrive at these. I assign each district a "Democratic Score", by taking the average of the Dem/Rep 2010 result and the Obama/McCain result. I then rate every district on a seven-item scale based on brackets I thought would be reasonable for a Democratic wave year, a neutral year and a Republican wave year. For instance, the 5th district gave Pres. Obama 53.3% of the vote and Dems in 2010 44.5% of the vote. It is rated a Toss-Up seat in a neutral year, Lean Democrat in a Democratic wave year, and Lean Republican in a Republican wave year.
The brackets are consistent over all three maps I'm presenting here.
I should also add that I made a small mistake, but I don't want to reupload the images. The number of strong GOP seats in a GOP wave year is 22, not 30.
As you can see, the GOP gerrymander locks in a probably 40-5-23 D delegation in a wave year, a 37-1-30 D delegation in a typical year and allows R's to reach a 34-2-32 delegation in a GOP year. It's about the best you can do in such a state as New Mexico, akin to the 1-1-1 map that a good GOP gerrymander in three districts can produce.
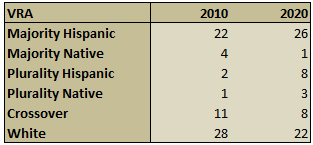
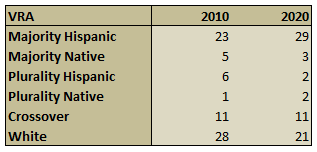
This table shows the VRA situation under the GOP plan-- both in 2010 and, using my formulas, extrapolated to 2020. A "Crossover" seat, is, of course, a plurality-White seat with a majority-minority population.
Right now, Whites are still a plurality in a majority of Congressional districts, but not so much in 2020.
Map-3-- Constitutional Dem gerrymander
Now let's contrast this with how Democrats might draw the map.
Political ratings:
First of all, the small correction: The number of GOP seats in a GOP year is 18, not 19.
Note that the number of GOP congressional seats that they would likely hold in a good year for them--22-- is less than the number of GOP seats they'd hold under the GOP map in a Democratic wave year--23. Such is the power of gerrymandering.
Under a neutral scenario, this map would result in a 47-2-19 Dem delegation, compared to the 37-1-30 of the GOP map.
VRA:
The Dem plan results in more Hispanic VRA seats than the GOP plan in both 2010 and 2020. Once you count in Hispanic plurality seats, however, the GOP plan will be more effective in 2010, as many seats that are currently 48-51% White will have shifted to Hispanic plurality status, while many of the White seats in the Democratic map are a lot further away from being majority-minority-- because they function as vote sinks.
Map-3-- Constitutional VRA gerrymander
This map tries to maximize the number of VRA seats regardless of partisanship. It does not make a difference between GOP-leaning Hispanic majority seats and Dem-leaning Hispanic majority seats either.
Politics:
Correction: In a good GOP year, this map would yield 17 safe GOP seats, not 23.
In a neutral year, this map would be a 43-3-22 Democratic map-- this is closer to the Democratic plan than to the GOP plan. In a GOP wave year, however, a lot of these districts could be swept by the GOP-- resulting in a 35-5-28 Dem delegation. In these years the VRA map is closer to the GOP proposal than to the Democratic plan. In good Democratic years this map is actually almost as effective for Democrats than the Democratic gerrymander, just that they'd have almost all districts locked up under the Dem plan while they just attain Lean/Likely D status here.
VRA:
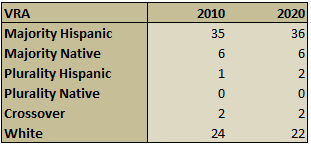
Wow. This plan creates majority-Hispanic seats in a majority of Congressional districts even now, while it locks in six Native seats for the decade. The Dem plan had just 5 Native districts, two of which would lose majority status over the decade, the GOP plan even less at 4 districts in the beginning, just one of which would still be majority-Native at the end of the decade.
Even better, five of the six Native seats would even at the end of the decade have a Native population of 60+% VAP-- considering that Native turnout is relatively unreliable, it should be at least that to give Natives the chance to elect a candidate of their choice. Interestingly, two of these districts could still elect Republicans in Republican wave years-- maybe we could see an increased number of Republican Native candidates here?
At the same time, the White seats that STILL exist under this plan are relatively locked in. Of the 24 seats that are majority-white in the beginning of the decade-- just barely more than a third-- 22 keep that status-- now less than a third. Of these, just 3 are likely to lose majority-White status by 2030. Assuming the Hispanic growth continues, the GOP plan might actually have less White seats than the VRA plan by 2030-- then again, you could just redistrict again in 2020.
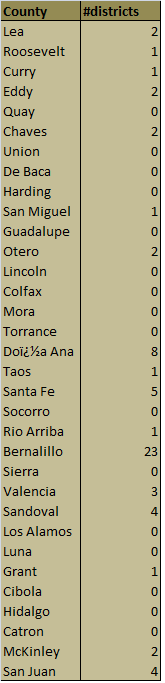
The last thing I want to show here is a table showing how many districts a county contains-- just for one plan, since it doesn't vary very much between the different maps. The metric is-- how many districts have more than 50% of their population in the given county.
That's it for my New Mexico maps.
Now, I promised some DRA meta-ideas, and here they are.
NONE of the tables in the diary were manually compiled. I'm very good at using Excel, and I used formulas that allow me to spit out these tables in one second once I plug in the VTD data and CD data .csv downloads from Dave's App. My thought is that I could do a more extensive Excel sheet that allows you to get instant analysis of the map you just drew and upload it somewhere on the internet.
I think there's actually not much that I COULDN'T implement with Excel, so I'd love to get some feedback on which features you'd want.
Some ideas apart from the ones already featured in the diary--
* Composition of the primary electorate in each district by County, for each Party. Useful for figuring out whether incumbents could be successfully primaried.
*Composition of the primary electorate in each district by race, allowing you to plug in different global numbers to test various assumptions (Whites vote 90% Republican, Blacks vote 95% Democratic, or White vote 55% Republican, Blacks vote 80% Democratic, Hispanics vote 60% Democratic, Others vote 65% Democratic--- whatever).
*The three (or maybe the n-)biggest counties for each district.
If you have any more suggestions, please tell me in the comments. There aren't many things you can't do with Excel.
