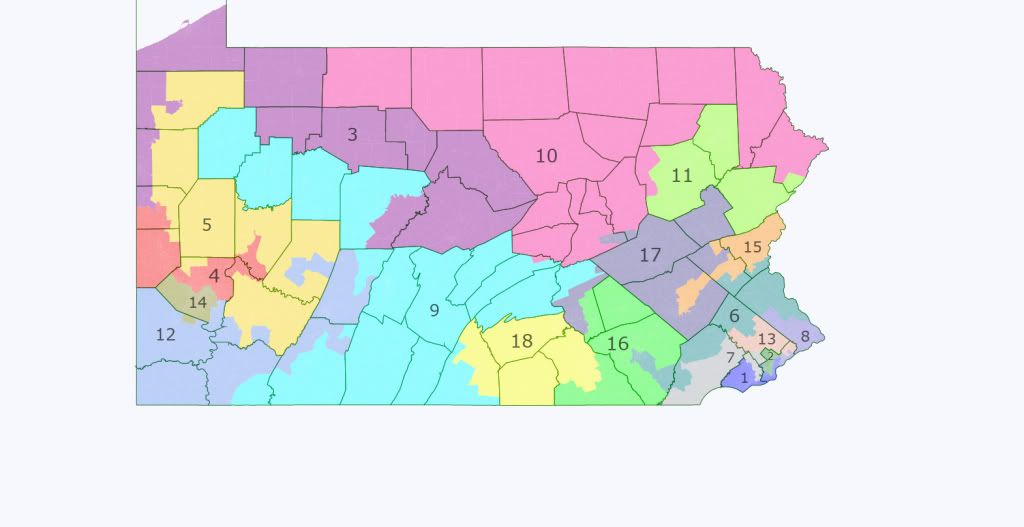
A few weeks ago, I decided to embark upon an effective, realistic Democratic gerrymander. I approached the scenario wondering what, in an alternate universe where the Democrats had the trifecta in state government, would be the likely lines drawn. As a result, the map leans towards protecting the interests of existing Democratic incumbents first and foremost. Two (Bob Brady and Mike Doyle) do take significant hits as a result of this map, but they retain the majority of their old district population, keeping seats which should be safe for them both in the primary and the general. All the other incumbents get shorn up (which isn’t a huge issue for Fattah, Schwartz, or Holden, but is for Altmire and Critz). Although it’s impossible to give Altmire a totally safe seat, I think he’d be the favorite to retain his seat all decade, and the other five Democrats would be totally safe.
The map also opens up new territory to Democrats. It turns three of the four Southeastern Pennsylvania Republican districts into solid D seats. It edges PA-11 a bit to the left, making it even more unlikely Barletta could hold it. Finally, it creates a Democratic-leaning of a district in Northwestern Pennsylvania.
I’m not a fan of baconmanders. In fact, I tried to not split any municipalities except when absolutely needed, besides Philadelphia and Pittsburgh. In a few cases, this resulted in a decline in average dem performance of a fraction of a percent compared to doing a spaghetti distict, but this doesn’t concern me much.
Finally, I built these districts around base Democratic performance. Obama over-performed in the Philly area, and under-performed in Southwestern PA. Although the long-term trends are positive in the former, and negative in the latter, the base D performance helps to even the score a little, and eliminate guesstimating. As a result, I used the older voting districts, not the newest PA map in DRA.
Around the state we go!
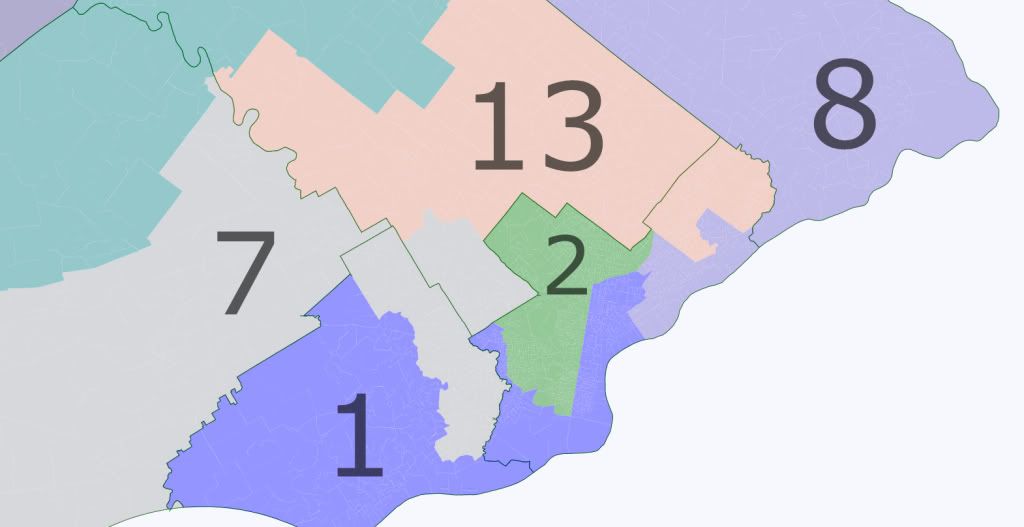
PA-1 (Bob Brady, D) – 70.1% D – 71.3% Obama (was 88%)
Brady’s district changes, but not as much as it looks. He retains his home in the district (along with the weird salient to grab it). He also retains most of his old territory except some weird tendrils into north and northeast Philadelphia. He however takes in a lot more of Delaware county. He essentially takes in the entire suburban portion which is Republican or swingy. Shouldn’t matter one bit, however, as this remains a super Democratic district. Strong D Hold
PA-2 (Chaka Fattah, D) – 90% D – 91.7% Obama (was 90%)
Fattah’s district is all but unchanged. Some lines are cleaned up in Philadelphia, but the biggest change is he loses suburban Cheltenham to Allyson Schwartz. It’s a shame that he can’t sop up some Republican voters, but really he’s essentially surrounded by Democrats in every direction, and Brady’s home is placed in the wrong area for him to snap up some Delco Republicans. Move along, nothing to see here. Strong D Hold
PA-3 (OPEN) – 53.5% D – 55.4% Obama (was 49%)
Now it gets interesting. This district bears some resemblance to the old PA-3, in that it still has Erie and the Hermitage/Sharon area. However, instead of traveling further south into the Pittsburgh exburbs, it travels to the southwest to grab State College, sopping up the lighter red counties along the way. It’s possible to improve performance by around half a percent with a border which doesn’t follow county lines so closely, but beyond this further improvement is impossible, as all other Democrats are sucked into Altmire’s seat. Northwest PA doesn’t show a trend away from Democrats like Southwestern Pennsylvania, and the two major hubs, Erie and State College, are getting bluer. On the whole I’d say this seat could go to a Democrat or a moderate Republican, and whoever wins it will hold it for the remainder of the decade. Lean D Pickup
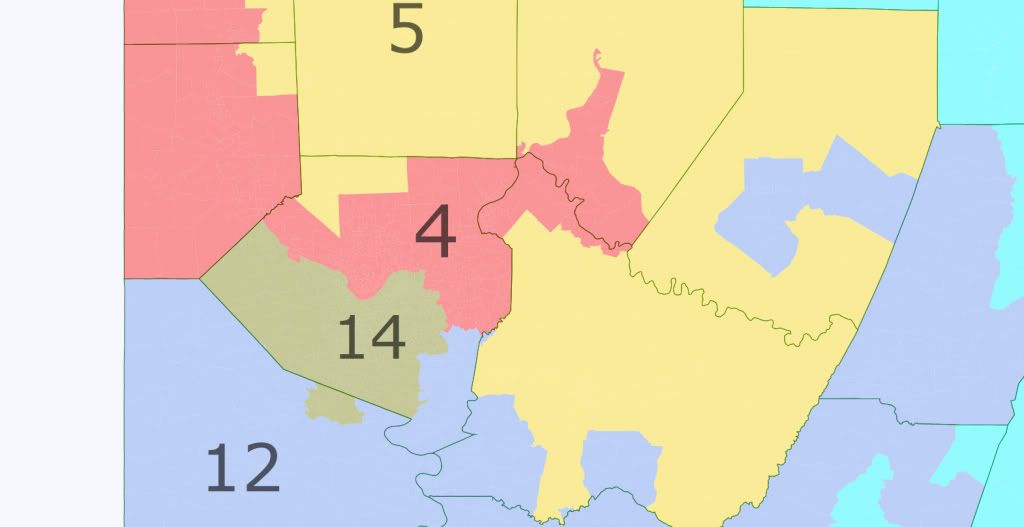
PA-4 (Jason Altmire, D) – 54.6% D – 50.8% Obama (was 44.4%)
There’s a lot of changes, but the basic district looks recognizable. It sheds Republican areas at the exurban fringes – most notably those in Butler and Allegheny counties. In exchange, it picks up a few different areas, including some conservadem areas in Washington and Armstrong counties, some East Hills suburbs which tilt Democratic, and the north side of Pittsburgh, which is around 50% African American. The district remains a bit too swingy for my liking, but it suits Altmire pretty well, as it retained some moderately Republican North Hills suburbs where he presumably plays well. Likely D Hold
PA-5 (Mike Kelley, R) – 59.6% R – 61.9% McCain
Although called PA-5, this district shares almost no territory with the old district of that number. It’s instead made up mostly of the Republican parts of PA-3, PA-4, and PA-18 which couldn’t be sopped up elsewhere. The weird way it and PA-9 wrap around each other in rural northwestern Pennsylvania is an unfortunate consequence of a few places where the districts narrow to a single township. Essentially PA-5 can’t take in all the rural counties, because then PA-9 would need some of Washington county, but that in turn would break up Critz’s district. Mike Kelley lives here, and represents a plurality of this district, so he’ll run here, and win easily. Strong R Hold
PA-6 (Jim Gerlach, R) – 53.9% R – 51% Obama (was 58%)
In my opinion, the Philadelphia suburbs aren’t blue enough yet to do without a Republican vote sink. So this district sweeps through the outer reaches of Bucks, Montgomery, and Chester, taking in everywhere where the partisan average leans R. It also takes in a few parts of the southern Lehigh foothills, and has a finger to take in Lancaster. The last because while this is still a pretty strong Republican seat, this makes it arguably one a Democrat could win absent a scandal, slightly expanding the map. For now, though, Jim Gerlach wins the prize of being the last Republican standing in the Philly burbs. Likely R Hold
PA-7 (Pat Meehan, R vs. Joe Pitts, R) – 56.6% D – 60.8% Obama (was 56%)
Call this the “Main Line” district. The district contains ultra-blue Lower Merion Township, highly Democratic eastern Delco, and mostly Dem-leaning parts of Chester County. The PVI is probably something like D+8, although I don’t have access to Kerry numbers. Joe Pitts would retire, and Pat Meehan would lose. Strong D Pickup
PA-8 (Mike Fitzpatrick, R) – 58.7% D – 59.2% Obama (was 54%)
Although a recognizable core remains, the district changes significantly. The northern, highly Republican parts of Bucks County are shed to PA-6. In their place are added the most Democratic parts of Northeast Philadelphia. The PVI is probably around D+6, which means a skilled Republican could hold it. Mike Fitzpatrick is not, however, a skilled Republican. Strong D Pickup
PA-9 (Glen Thompson, R) – 64.1% R – 64% McCain (was 63%)
Thompson’s old district is recognizable here, although it changes in detail, particularly with the salient to grab three rural counties from the old PA-5. He should be fine for re-election here for the indefinite future. Strong R Hold
PA-10 (Tom Marino, R) – 61.9% R – 58.3% McCain (was 54%)
The district loses very little (mainly the fringes of the Wyoming Valley), but the sparsely populated areas it picks up make it look a little different. Even Tom Marino, for all his flaws, should be able to hold this down. Strong R Hold
PA-11 (Lou Barletta, R) – 56.9% D – 58% Obama (was 57%)
This district has just moved a bit at the margins. It has traded Republican-trending areas in Columbia and Carbon counties for a bigger slice of Lackawanna County. This makes it about 1% more Democratic than it used to be. Lou Barletta would probably be toast even if the district lines were unchanged, but forget about it with this map. Strong D Pickup
PA-12 (Mark Critz, D) – 56.4% D – 49.9% Obama (was 49%)
The salient into northern Washington and Armstrong counties is gone, as Altmire has picked up the ancestral Dem areas, and the rest have moved too far to the right to bother with. In exchange, Critz mainly gets light-pink areas of Washington county (from Tim Murphy), and more of the Mon valley in Allegheny county, Clairton and McKeesport (from Mike Doyle) most notably. The new district is around 1% more left wing than the old one. While the Obama total is lower than Altmire’s district, there are a fair number of die-hard Democrats in this district who were unfortunately unable to pull a lever for a black man. Trends are not in our favor here, but this seat is fine for now. Strong D Hold
PA-13 (Allyson Schwartz, D) – 58% D – 59.8% Obama (was 59%)
I thought Schwartz would take a hit for the team, but surprisingly, she gets a boost. Her core in southern Montgomery county remains. She loses both territory in conservative upper Montgomery, as well as a lot of territory in Northeast Philadelphia, only grabbing the more conservative wards so as to leave the more solid Dem areas for PA-8. Apparently gaining Norristown and Cheltenham more than makes up for it however. Strong D Hold
PA-14 (Mike Doyle, D Vs. Tim Murphy, R) – 63.3% D – 61% Obama (was 70.7%)
Doyle takes the second-biggest hit for the team, but he should be fine. He sacrificed some territory to the north and east to Altmire and Critz. However, he retains most of Pittsburgh, and the first-ring suburbs to the east and southeast. He takes in a good deal of suburban territory formerly in Tim Murphy’s district however – all of the South Hills in Allegheny county, and even blood-red Peters Township (full of commuters evading Allegheny county taxes) in Washington county. Still, far more people live in Doyle’s segment, and Democrats essentially always hold down districts of this strength. Strong D Hold
PA-15 (Charlie Dent, R) – 58.3% D – 60.3% Obama (was 56%)
I am not of the opinion that Charlie Dent is the indestructible monster that some people here think he is. He faced lousy candidates in 2006 and 2008, and while his 2010 opponent was more formidable, it was a terrible year for any Democrat to make a pickup. So I decided to help the next one. The district remains Lehigh centered. The salient into the Philly burbs is removed. Also gone are the south bank suburbs, and some of the northeastern part of Lehigh. In return, it travels deep into Berks, and plucks out Reading. Also interestingly, the seat is now 21% Latino. I just don’t see any way the Republicans hold onto a seat like this. Strong D Pickup
PA-16 (OPEN) – 66.3% R – 60.4% McCain (was 51%)
Although this shares some territory in Lancaster county with the old PA-16, it lacks an incumbent, as Joe Pitts lives nowhere near it, and given his age, I think he’d prefer to retire. I’m sure some budding young reactionary would come to the fore however. Strong R Hold
PA-17 (Tim Holden, D) – 51.5% R 50.7% Obama (was 51% McCain)
Although Tim Holden didn’t need it, I decided to shore him up a little in case of an open seat. He keeps almost all of Schuykill county, along with Harrisburg, so he should be happy. Ditching Lebanon county should also make him pleased. In exchange, he gets all of Berks which isn’t in PA-15 – territory he represented back in the 1990s, which is swingy to light pink and should suit him fine. He also gains Carbon county a roughly 50/50 conservative Democrat stronghold which should fit him well, plus Shamokin and a few bits of Lehigh County. Given he had no issue holding down his old district, he should have no issue holding this as well. Strong D Hold
PA-18 (Todd Russell Platts, R) – 61.1% R – 56.3% McCain (was 56%)
This is essentially the old PA-19, as Tim Murphy’s district was eliminated. It remains centered on Adams, Cumberland, and York counties, but shifts a bit to the west. Should be no issue for him to hold down. Strong R Hold
Absent a scandal, our lower range on this map is 10D, 8R. Our realistic upper range is 13 D, 5R. Gerlach’s seat may be swingy by the end of the decade, but then again, Altmire’s will be as well.
Thoughts?
