With the Tuesday primary coming up, the pre-primary voter registration counts have been published.
This diary is part of a series looking at voter registration in Arizona, in order to help determine whether the State could become competitive in the upcoming elections. Frustratingly the Democrats have still not recovered to 2008 levels, and voters are being transitioned from the "active" voter rolls to the "inactive" voter rolls. I presume a large amount of inactive voters are being kicked off the rolls altogether, as Obama for America must be registering lots of voters...
What is really messed up is that while registered Republicans make up around 36% of active voters compared to the Dems 30%, for inactive voters the Dems outnumber the GOP 31% to 26%.
For anyone that can provide a bit more analysis on these numbers feel free... but at this moment it appears that the Dems have failed to make much headway despite making some progress in blue districts.
Overall Numbers
Good news ! The number of active registered Dem voters has increased from 946,614 to 935,098 ! Wait a second that is a decrease... The total number of "active" voters is down by 45 thousand overall. How is that possible given Obama For America are registering voters left and right in Arizona ? Well overall the number of "inactive" voters has increased by 81,507, so it seems the number of active voters pushed onto the inactive voter rolls is greater than the number of newly registered voters.
Active Voters - August 2012 Active Voters - June 2012
Democrat: 935,098 (30.16%) Democrat: 946,614 (30.09%)
Republican: 1,113,123 (35.90%) Republican: 1,130,164 (35.92%)
Others: 1,052,345 (33.94%) Others: 1,069,195 (33.99%)
Total: 3,100,575 Total: 3,145,973
%VEP: 69.23% %VEP: 70.24%
Inactive Voters - August 2012 Inactive Voters - June 2012
Democrat: 167,390 (31.32%) Democrat: 147,599 (32.59%)
Republican: 139,232 (26.05%) Republican: 113,125 (24.98%)
Others: 227,836 (42.63%) Others: 192,227 (42.44%)
Total: 534,458 Total: 452,951
%VEP: 11.93% %VEP: 10.11%
Total Voters - August 2012 Total Voters - June 2012
Democrat: 1,102,488 (30.33%) Democrat: 1,094,213 (30.40%)
Republican: 1,252,355 (34.45%) Republican: 1,243,289 (34.55%)
Others: 1,280,190 (35.22%) Others: 1,261,422 (35.05%)
Total: 3,635,033 Total: 3,598,924
%VEP: 81.2% %VEP: 80.36%
Assumption: Voting Eligible Population is 4,478,732 which I calculated using the data from the Independent Redistricting Commission submission to the Department of Justice.
Key Legislative District Statistics
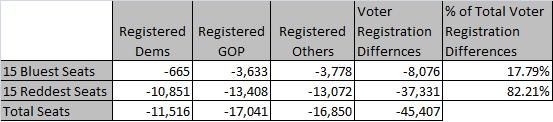
Okay, so it is not just about the overall stats, what is happening in the key Legislative Districts ? Well I couldn't help but notice that the number of registered voters in red districts contains the lions share of the loss in active registered voters. The table below compares the 15 most red seats against the 15 most blue seats.
If you compare the 18 most red seats against the 12 most blue seats the numbers are even more skewed.
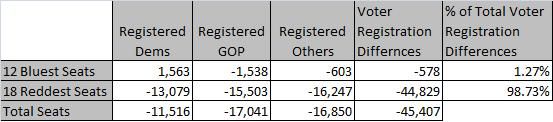
On average there is almost no loss of active registered voters in the 12 bluest districts, almost all of the losses have occurred in the 18 reddest districts. In fact, there is a modest gain of registered Dems in the 12 bluest districts !
So it seems that for one reason or another the blue parts of Arizona contain relatively motivated registered voters when compared to the red parts. Of course... without knowing how many active voters were shifted to the inactive voter rolls it is hard to know the true state of affairs.
Which individual districts had the biggest gains ?
Total voters: the Mohave based 5th (+1,711) and the Tucson based 9th (+1,109),
10th (+1,048), and 2nd (+1,004)
Dem Voters: the Phoenix based 27th (+737), and the Tucson based 9th (+641),
10th (+523), and 2nd (+534)
GOP Voters: the Mohave based 5th (+742) and the Navajo Nation focused 7th (+606)
Oth Voters: the Phoenix based 30th (+413)
Which individual districts had the biggest losses ?
Total voters: the Prescott based 1st (-5,702) and several red seats lose 4,000-5000.
Dem Voters: the Navajo Nation based 7th (-1,092) and the Tempe/Mesa based 26th
(-772) were the blue seats with the biggest losses and several red seats
lost around 1,000-1,500 Dems with the 25th (-1,532) the highest loss,
along with the battleground Flagstaff based 6th (-1,019).
GOP Voters: the Prescott based 1st (-1,763), the 12th (-2,132) the 17th
(-1,788) and the Mesa based 25th (-1,762) and several red seats have
lost around 1,000-1,500 GOP voters.
Oth Voters: the Prescott based 1st (-2,587), the 12th (-1,903) the 17th
(-1,983)
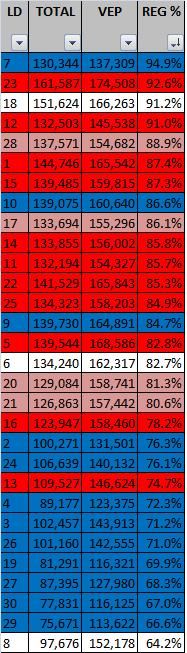
Overall which seats have the highest % of Voting Eligible Population that are registered voters, whether active or inactive ? You guessed it, as per last time, the Hispanic seats are still those with the lowest % of VEP that are Registered Voters. Interestingly the Secretary of State doesn't publish the combined figures, so I had to add up the active and inactive voters.
Trends
The number of active voters is down, as no doubt Bennett directed the county clerks to do a purge to ensure that non-existent voter fraud doesn't occur. All types of registered voter was down with 11,516 less Dems, 17,041 less GOP, and 16,850 less Others. A total of 45,398 less active voters.
The number of inactive voters is up, with 19,791 more Dems, 26,107 more GOP and 35,609 more others. A total of 81,507 more inactive voters than in June...
Conclusions
-We are still going backwards overall, although making slight progress in blue districts, it is hard to see how we can register 100,000 more voters as OFA wanted to do.
- We still need more data to identify how many voters are being made "inactive voters" by Ken Bennett.
Further Info
For my spreadsheets with the full numbers, please see below the fold.
Please vote in the poll.
Any feedback appreciated.
Arizona Registered Voters - By The Numbers
The following tables show the numbers and percentages of registered voters by party. The final column shows the % of the Voting Eligible Population that are registered voters.
The Voting Eligible Population is my calculation created by using the Hispanic CVAP figures. The colour coding reflects the Democratic seats (blue), the competitive seats (white), the GOP leaning seats (pink), and the Solid GOP seats (red).
Registered Voters
Registration Numbers (Aug)
If you want to see the background to this diary please check out these other diaries:
If you want to see the background to this diary please check these previous Taking Arizona Diaries dealing with voter registration
