For those who rather avoid the worst of the anticipated Austerity procedures, just around the corner, I would suggest getting very familiar with these 2 cost-containment Indexes:
1) CPI-E -- Consumer Price Index for Elderly populations older than 62
2) MLR - minimum medical loss ratio
Bureau of Labor Statistics
Attachment F: Experimental CPI for Americans 62 Years of Age and Older
by Kenneth J. Stewart and Joseph Pavalone
Introduction
The Consumer Price Index (CPI) of the Bureau of Labor Statistics (BLS) measures the average change in prices over time for a fixed marketbasket of goods and services for two population groups. The CPI for All Urban Consumers (CPI-U) represents the spending habits of about 80 percent of the population of the United States. The CPI for Urban Wage Earners and Clerical Workers (CPI-W) is a subset of the CPI-U population, and represents about 32 percent of the total U.S. population.
In addition to the official CPI's for the CPI-U and CPI-W populations, the CPI calculates an experimental price index for Americans 62 years of age or older [CPI-E]. The Older Americans Act of 1987 directed the BLS to develop this experimental index.
[...]
Table 2. Comparative analysis of CPI relative importance data of selected expenditure groups, December 1995.
Expenditure Group CPI-U CPI-W CPI-E
All items 100.00 100.00 100.00
Food and beverages 17.33 19.26 15.00
Food at home 9.88 11.21 9.66
Food away from home 5.89 6.37 4.23
Alcoholic beverages 1.57 1.68 1.10
Housing 41.35 38.89 46.89
Shelter 28.29 25.98 33.88
Apparel and upkeep 5.52 5.53 3.93
Transportation 16.95 19.02 13.82
Medical care 7.36 6.26 12.14
Medical care commodities 1.28 1.06 2.57
Medical care services 6.08 5.21 9.57
Health Insurance .36 .25 1.09
Entertainment 4.37 4.03 3.35
Other goods and services 7.12 7.01 4.87
College tuition 1.61 1.19 0.59
Relative behavior of price indexes
[...]
A more detailed examination of the indexes shows that the CPI-E had the highest rate of price increase of the three populations for four of the seven major groups. Medical care prices rose in excess of two times the rate of the average for all items in each population group during this 5-year period. Analysis of the relative importance data for the CPI-E, the CPI-U and CPI-W populations indicate that older Americans devote a substantially larger share of their total budgets to the medical care (see table 2). Because of this, and because the medical care component of the CPI showed the largest price increase, medical care accounts for most of the difference between the higher rate of increase in the CPI-E experimental index -- as compared to the CPI-U and CPI-W indexes -- during the 1990-95 period.
Within the medical care component, the experimental index [CPI-E] population has larger out-of-pocket costs than the CPI-U and CPI-W populations as reflected in the difference for medical care services. [...]
Conclusions
This report analyzed the changes in the prices of three population groups: CPI-U, CPI-W, and the CPI-E, the experimental population of Americans at least 62 years of age, for the period December 1990 through December 1995. Analysis of the relative behavior of the three indexes at the all-items level revealed that the experimental index, which rose 15.9 percent during this period, had a higher rate of increase than the indexes for CPI-U and CPI-W, which rose 14.7 and 14.1 percent, respectively.
The experimental price index, reweighted to incorporate the spending patterns of older consumers, behaved more like the CPI-U than the CPI-W. This was expected, because the CPI-U includes the expenditures of all urban consumers, including those 62 years of age and over. The CPI-W, however, is limited to the spending patterns of wage-earner and clerical families and, therefore, specifically excludes the experience of families whose primary source of income is from retirement pensions.
[...]
The various CPI-Indexes are there, to protect beneficiaries --
not fleece them.
We should be advocating seniors be pegged to the CPI-E Index -- not to the "Chained" slow-motion one.
Besides ...
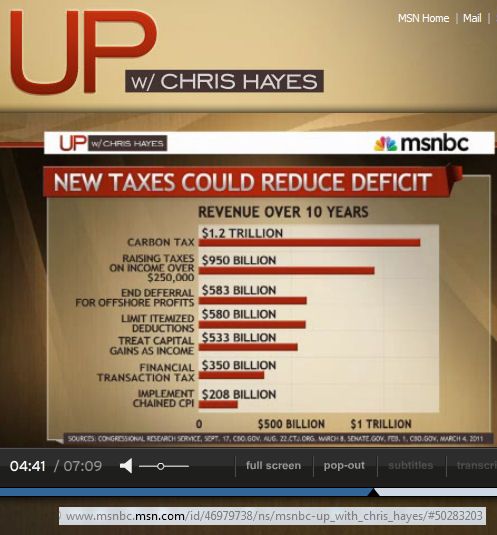
The Chained CPI is projected to only Cut Spending by $208 Billion over next 10 years (see the last bar on the chart). Certainly there must be some more fair and humane ways to raise 21 Billion a year? Better than playing 3-Card-Monty with seniors' already too-meager, cost of living fixed-income increases.
That's where the 2) MLR Index comes into the picture ...
First off what IS the "Medicare Problem" -- that the Tea Party "Austerity Scalpels" are bound and determine to cut out of Budget, no matter the pain, or economic fallout?
Health Spending Growth Projected To Average 5.7 Percent Annually Through 2021
by Chris Fleming, healthaffairs.org -- June 12, 2012
New estimates released today from the Office of the Actuary at the Centers for Medicare and Medicaid Services (CMS) project that aggregate health care spending in the United States will grow at an average annual rate of 5.7 percent for 2011 through 2021, or 0.9 percentage point faster than the expected growth in the gross domestic product (GDP). The health care share of GDP by 2021 is projected to rise to 19.6 percent, from its 2010 level of 17.9 percent.
[...]
The major effects of the Affordable Care Act on overall spending levels are expected to be felt most acutely in 2014. The coverage expansions associated with the Affordable Care Act for Medicaid and private health insurance are expected to increase the growth rate for health spending to 7.4 percent in 2014, with notable increases in spending on physician services and prescription drugs by the newly insured. Throughout the latter half of the projection period, incomes are expected to be higher, and a large number of baby boomers are anticipated to be receiving coverage under Medicare. Among others, these factors are expected to drive health spending up around 2 percentage points faster than overall economic growth by 2020, consistent with trends in the United States for about the past thirty years.
[...]
It's this: Health Costs expect to growth "2 percentage points faster than overall economic growth" (ie GDP).
And here's one place we might get that 2% growth rate back into the revenue coffers -- without ever "chaining" seniors' CPI to anything -- other than their "actual" cost of very expensive living ...
Does Obamacare Limit Profits for Health Insurance Companies in Your State?
by Jason Shafrin, thehealthcareblog.com
[...] The ACA imposes a minimum medical loss ratio (MLR) on all insurers. The MLR is the amount of money spent on covered person medical care divided by the total revenue received through premiums. [...]
The ACA requires health insurers in the individual and small group market to spend 80 percent of their premiums (after subtracting taxes and regulatory fees) on medical costs. The corresponding figure for large groups is 85 percent. [...]
Even though the MLR is a national law, it may not apply in your state.
Why? Because many States are petitioning for a waiver. HHS is currently reviewing applications from six states: Florida, Kansas, Michigan, Texas, Oklahoma and North Carolina.
We don't charge people a 15% surcharge to eat? Do we?
SO WHY in the world do we allow a 15% to 20% profit surcharge for "the privilege of receiving" life-sustaining medical treatment ???
WHY in the world DON'T we had a choice of a Public Option, which has only a 2-3% profit/administrative margin built into its fees? It would seem we could solve that measly 2% growth rate "driving health spending up," up, UP, just by trimming that MLR Index rate, a tad.
That dreaded Medicare Cost Curve that puts Tea Party accountants into an Austerity fever, has a few very simple "common sense" remedies:
Lower the MLR to 10% OR Give us the choice of a Public Option (which lets us cut it to 3% individually).
Plain and simple, actual cost-cutting. Not earned-benefits Austerity-cutting.
So how about it Tea Party Docs, how about "cutting" some of those Insurance Companies MLR "profit margins" -- and try for once, to leave our Elderly retirees alone?

