Following up on my recent magnum opus diary on the impact of gerrymandering nationwide, I was curious as to just how many more seats Democrats could have won by just changing our own actions and essentially holding the Republicans' constant. I had previously written about the Arkansas dummymander that cost us two seats, but I wondered if there were enough seats nationwide to cost us the house.
Looking at the underlying data, potential candidates and their recruitment, DCCC/HMP spending decisions, and some alternative maps in places where we made foolish redistricting related moves, my hypothesis is that there were enough instances where our own actions cost us enough seats to amount to retaking the house. Below the fold I'll present my maps and arguments in detail, but for now let's just look at the seats in particular and a national map:
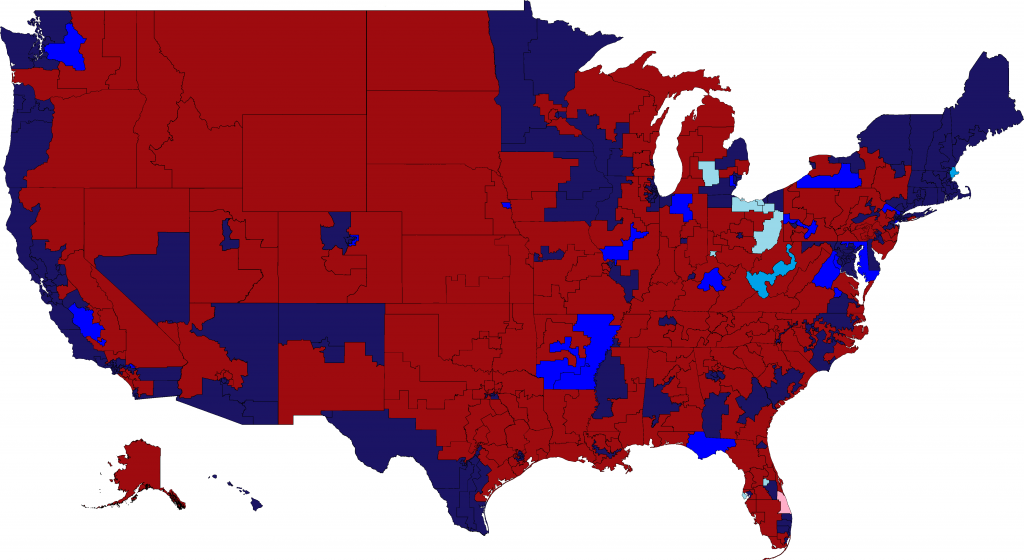
(Click through for larger image)
Seats in Vivid Blue are those where I think we could have changed the outcome. Those in Light Blue are those where we could have changed the outcome through ballot initiatives in 2010/2011 and those in medium blue are those we won that could have been further protected through gerrymandering.
The seats in total amount to a net gain of 20, or 27 if you include possible ballot initiatives in Florida, Michigan, Nebraska, and Ohio where Republicans gerrymandered, giving us a House majority of 221 to 228 seats. The seats in particular where the outcome could have changed generally fall into three not-mutually-exclusive categories: Candidate Recruitment, Outside Spending, and Redistricting. Let's take a look seat by seat.
AR-01 - Redistricting/Recruitment
AR-04 - Redistricting/Recruitment
CA-21 - Recruitment
CA-31 - DCCC
FL-02 - DCCC/Candidate
*FL-10, FL-13 (gain), FL-18 (loss) - Ballot Initiative
IL-13 - Redistricting/Recruitment
IN-02 - DCCC/Recruitment
KY-06 - Redistricting/Recruitment
MD-01 - Redistricting
*MI-07 - Ballot Initiative
MI-11 - DCCC/Recruitment
NE-02 - DCCC/Ballot Initiative
NJ-05 - Redistricting
NY-11 - Recruitment
NY-23 - DCCC
*OH-01, 05, 06, 07 - Ballot Initiative
OH-14 - Recruitment
PA-12 - Candidate
VA-04 - Redistricting
VA-07 - Redistricting
VA-10 - Redistricting
WA-08 - Redistricting
So now let's go below the fold to look at each seat in detail.
The Arkansas Dummymander
Arkansas Democrats, until this last year's election, had held the state legislature since Reconstruction and along with our hold on the Governor's and Attorney General's offices maintained total control over both congressional and legislative redistricting. Eager to retain the legislature, state Dems drew an aggressive gerrymander of each chamber which certainly helped minimize some of our losses there in 2012. With the congressional map though, Democrats foolishly tried keep both of the two seats lost in 2010 winnable as the previous decade's map had done. Then, 6-term 4th district Rep. Mike Ross (D) retired after the map was drawn, depriving us of his incumbency and leaving us scrambling for a replacement candidate. The result is that instead of three seats, we now hold zero of the state's four districts. How could Arkansas Democrats have drawn a better map and what makes the map they drew a "Dummymander"?
The Arkansas Congressional Map
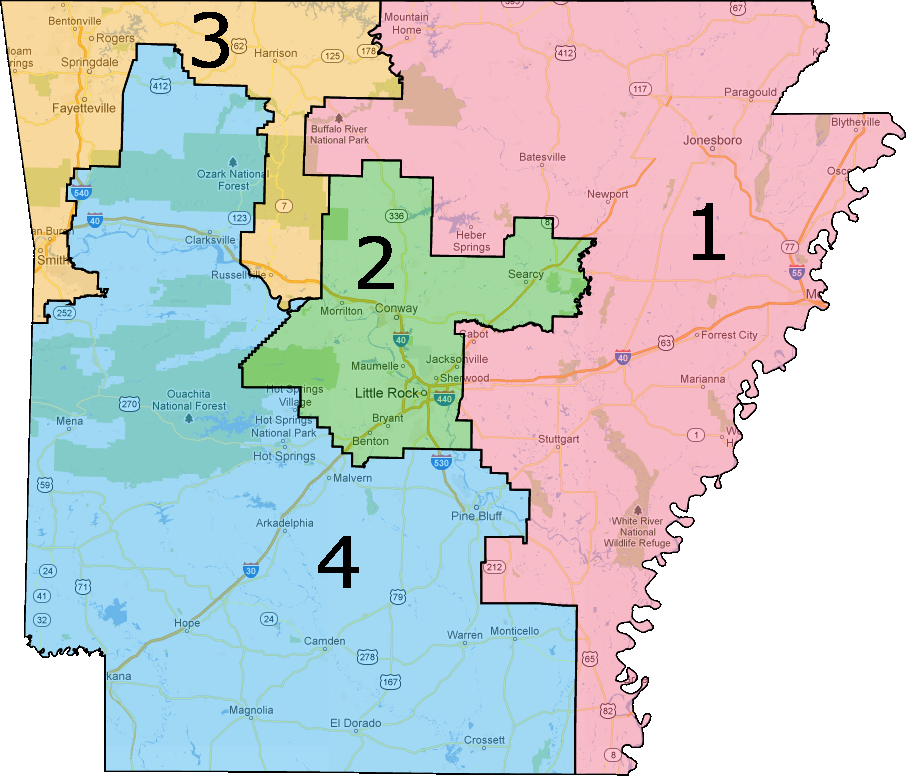
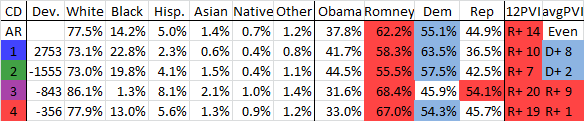
Following the census, Arkansas stayed at 4 districts and merely had to accommodate population disparities between the districts. The 2nd district and heavily Republican 3rd had to shed population while the 1st and 4th needed to gain it. Thus, Dems moved the 1st 0.7% to the left by having it grab a few small Delta counties. The 2nd shed Yell County to otherwise stand pat. The 4th, having to gain the most population, added heavily conservative parts of the Ozarks in the northwest of the state, shifting about 1.5% towards Republicans.
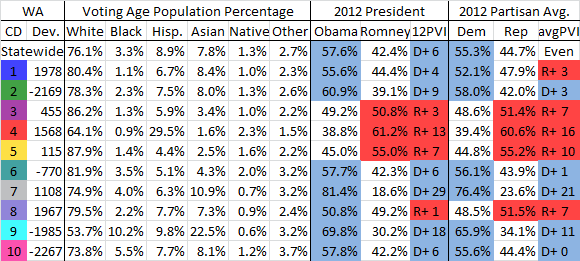
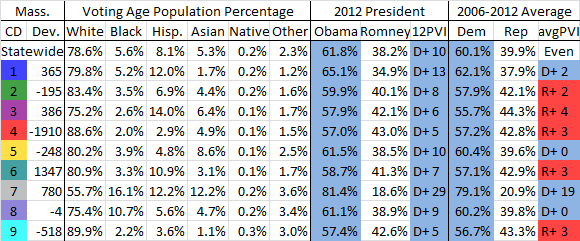
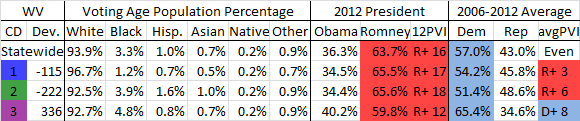
The result is that, when looking at the partisanship of the districts below the presidential level, we were left with this:
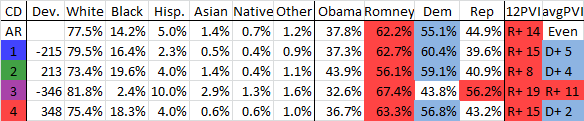
Note, the partisan average consists of all D vs R statewide races below president since 2006. I did this to be able to make an apples to apples comparison between the districts since the races are all the same. Additionally, the average is calculated without county splits, so the 3rd and 4th might be marginally different, but the presidential numbers are accurate. All population figures are Voting Age Population only and all partisan numbers are two-party share only.
As you can see, all three of the 1st, 2nd, and 4th are more Democratic than the state while the 3rd is quite clearly packed. However, none of the districts is significantly more Democratic than the state at large and Romney won all of them comfortably. With Rep. Ross retiring and Democrats running three weak, underfunded candidates, Republicans were able to win every district with ease.
The Art of the Dummymander
What exactly is a Dummymander? Well it's a gerrymander that, instead of benefiting the party that drew it compared to a non-partisan map, actually hurts the party compared to that same baseline and results in the party winning a much lower number of seats than expected. This can be caused by spreading one's partisans too thin, or by not taking into account partisan trends and incumbency. This happened famously with the 1992 Georgia Dem gerrymander (pdf) that turned a 9D-1R advantage in 1991 into a 3D-8R deficit by 2001.
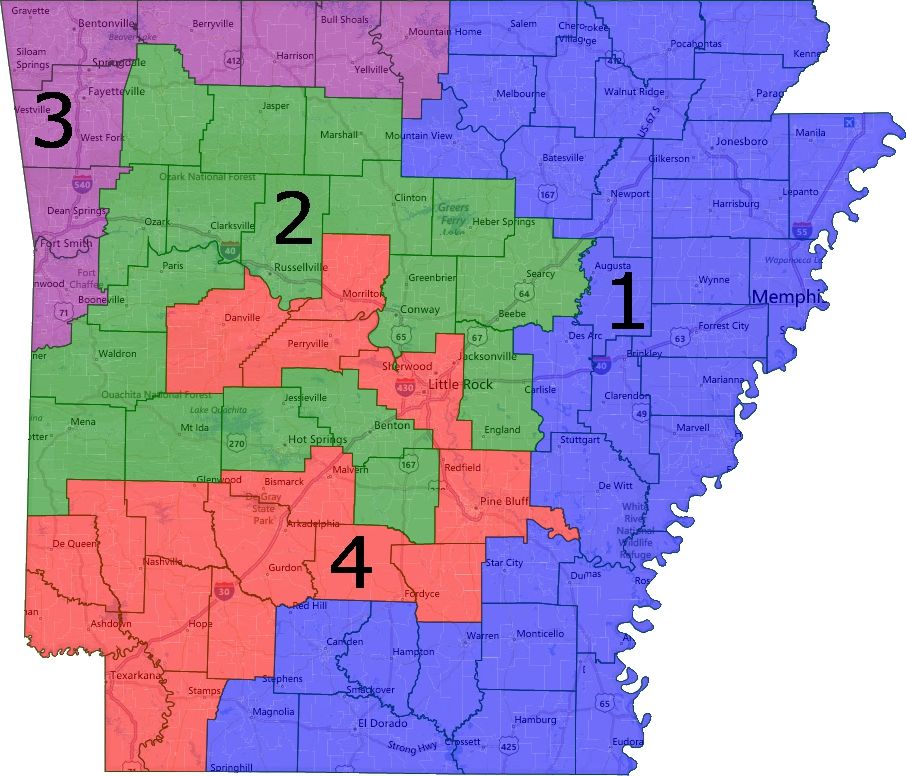
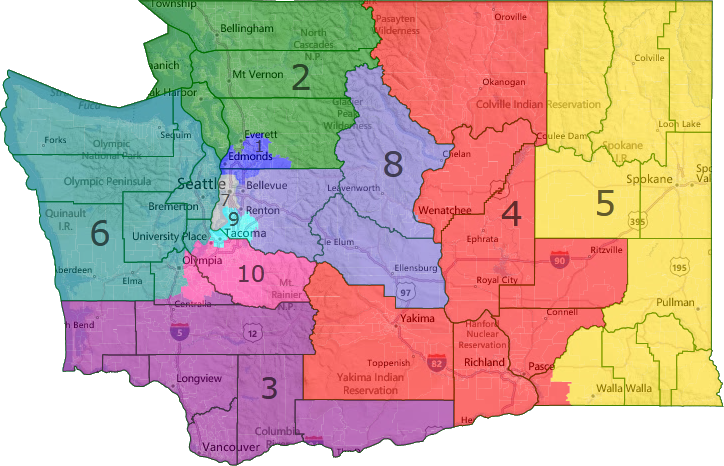
With that in mind, the next step then is to determine what a non-partisan map of the state might look like. The criteria I had in mind were similar to that of the California citizens' commission-drawn map that valued compactness and communities of interest and ignored partisanship. Clearly this is a subjective exercise and there are multiple ways to draw the map, but here is one version I feel is quite realistic that a court or commission might draw:
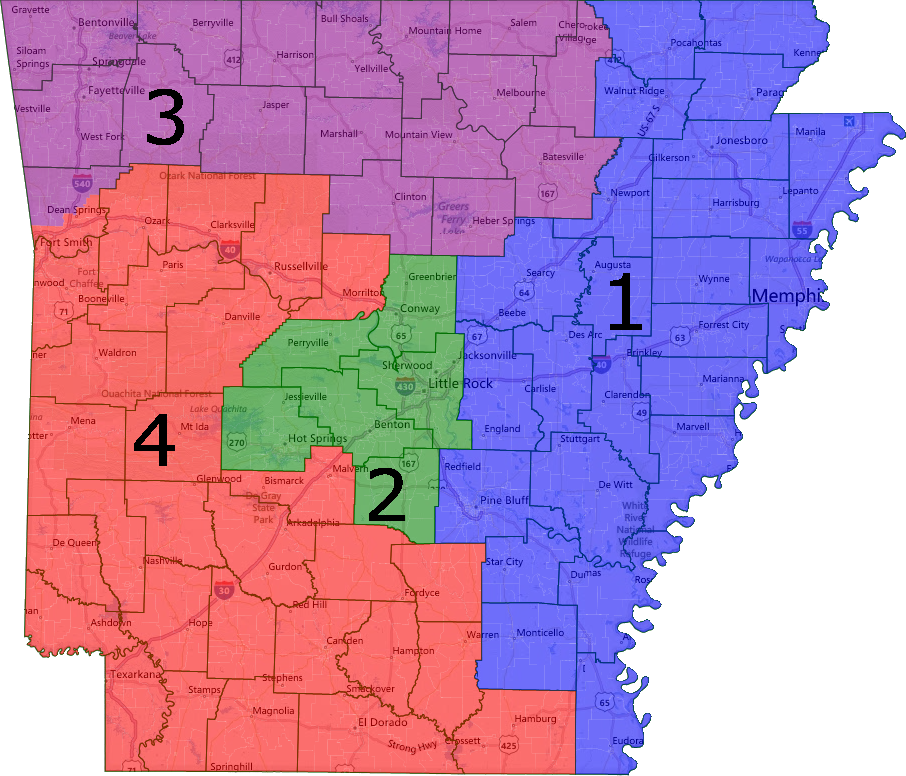
Arkansas' regions pretty neatly fit into four districts with the Delta comprising the 1st, the Little Rock area in the 2nd, the Ozarks in the 3rd, and South Arkansas in the 4th. In contrast to the actual map, there's a clear Democratic district, the 1st.
Compared to the real map, the 1st drops parts of the Ozarks in north-central Arkansas and adds Pine Bluff and the rest of the Delta. It gets 3% more Democratic and instead of just 6% of the district being new, it's now nearly 29% new to incumbent Rep. Rick Crawford (R). Despite Obama getting just under 42% there last year, it's by far the most Democratic of the four. John Kerry won nearly 51% there in 2004 and Sen. Blanche Lincoln won 48.4% in 2010 while getting just 39% statewide. No other Democrat lost the district; even in 2010 our house nominees won 51%. Tallying up the actual election results from 2012, our 1st district nominee, prosecutor Scott Ellington (D), and 4th district nominee, state Sen. Gene Jeffress (D), won a combined 44.4% to Rick Crawford's and Tom Cotton's 55.6%. However, a sizable proportion of that figure comes from the 4th district where Rep.-Elect Tom Cotton (R) was a much stronger opponent than Rick Crawford and Jeffress ran a very 19th century campaign with little advertising. With a stronger, more well funded challenger such as 2010 nominee (and former chief of staff to then Rep. Marion Berry) Chad Causey, Democrats likely could have gained the 5.6% vote share needed for 50%+1.
Unfortunately, the 2nd district slides the other way, though it remains more Democratic than the state. The district gets 1.6% more Republican and would have been fairly secure for Rep. Tim Griffin. Our house nominees, Jeffress and attorney and former state Rep. Herb Rule won 42.2% there last year, which certainly could have been improved upon with a well funded Blue Dog, but unlike in the 1st Griffin is a strong incumbent and clearing 50% would have been difficult. If this district were open it would be competitive, but Griffin would have won this last year.
The third district gets slightly less Republican, but is still dark red and Rep. Steve Womack (R), who was unopposed in 2012, would have certainly won reelection.
The 4th district, like the 2nd, gets more Republican under this non-partisan map thanks to the loss of Pine Bluff and the addition of Fort Smith. Had Mike Ross not retired we might have held this seat, but without him Tom Cotton would have seen an even larger win over Gene Jeffress. This seat isn't completely out of reach though, as Democrats have a strong bench with state Sen. Larry Teague, who holds down a conservative district, and University of Arkansas Community College chancellor Chris Thomason coming to mind. Still, Cotton would have likely gotten even more entrenched than he will in his actual district, so Democrats probably wouldn't win this one period.
Thus, by drawing the map they did, Democrats actually received 1 seat less than they would have under a non-partisan map, making theirs a Dummymander.
The Map Dems Should Have Drawn
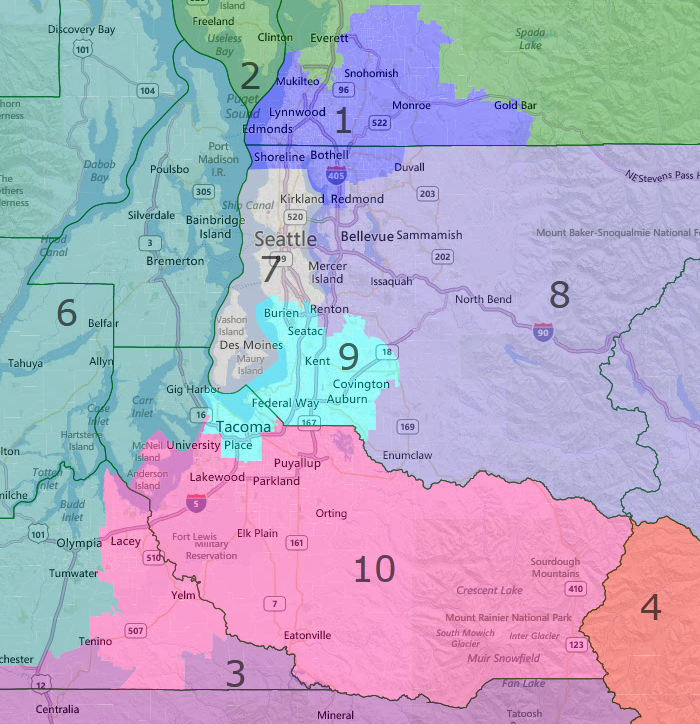
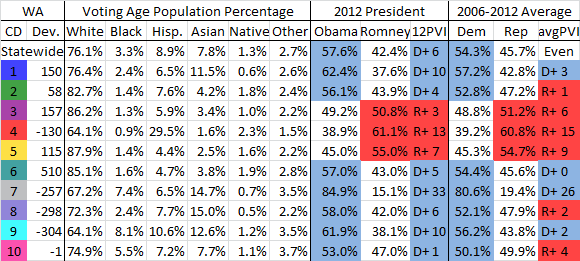
With our poor performance at winning three of four seats in 2010 and 2012 in mind, I set about to draw a strong 2D-2R map that Democrats could and should have drawn. With Mike Ross retiring, the 4th district needed to be shored up in a way that didn't entice Tim Griffin into running there. This was a bit tricky since some of the most Democratic parts of the state in Little Rock were in the 2nd. Next, I aimed to defeat Rick Crawford in the 1st. Finally, since I was using county-level data and Arkansas has historically not split counties during redistricting, I had to make sure all districts were within + or -1% of the target population. With a budget for gathering precinct-level data, Arkansas Dems could have drawn an even more effective map than this one by splitting counties and precincts.
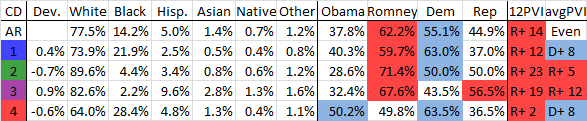
Under this map, the 1st gets 2.6% more Democratic for a total of 8% more Democratic than the state and it's 24% new to Rick Crawford. Though Obama only received 40.3% here in 2012, John Kerry barely lost it by just 731 votes in 2004 and Blanch Lincoln won 47.2% in 2010. Our House candidates won 45.4% and that should have easily gone past 50% with a well-funded candidate like Chad Causey. This seat should have been Lean D, with the end result probably being around a 54%-46% Dem win. Candidate Recruitment though is essential as Scott Ellington still would have lost and we'd have needed someone whom the DCCC thought was a good investment.
The 2nd district is the key to this map since it drops heavily Dem Little Rock but still entices Griffin into running there. The district is 55% new to Griffin, but it's over 9% more Republican and significantly safer than the neighboring 4th. Griffin would have had this seat as long as he wanted it if he made it past the primary.
The 3rd is almost entirely the same as was drawn with only 6% being new, meaning Womack would have been unopposed again and like Griffin would have had the seat as long as he wanted it.
The 4th district here looks radically different than the real version thanks to avoiding the Ozarks and the addition of Little Rock. Tom Cotton still lives here, but he and other ambitious Republicans might have run in the much safer 2nd district instead. It is made 6.7% more Democratic for a total of 8.4% more Dem than the state and Obama actually won it last year by 1004 votes. John Kerry won 54% here and Blanche Lincoln was the only Democrat to lose it since 2006 and that was by just 439 votes. Combining Herb Rule's and Gene Jeffress' vote shares gets Democrats to 49.3% and with any competently run campaign we would have held onto it easily making it Safe D. With this sort of district, I'd imagine we could still get Mike Ross to run here given how he'd cruise and then retire in 2014 to run for governor as he is actually doing.
Overall, that brings us to plus 2 in the state for 2012 and probably a few more cycles. though we might lose the 1st, the second would not be lost this decade. Instead we got a 0-4 split that seems likely to last.
California
California saw the first time the state used the new top two primary system where all candidates are lumped into one race run with their party affiliation in the first round and the first two plurality winners advance regardless of part. This unfortunately led to two Republicans winning the runoff spot in CA-31 by roughly 1,000 votes. Had then Rep. Joe Baca (D) run here where most of his district was instead of fleeing to the safer confines (or so he thought) of CA-35, this one becomes a slam dunk. However, even if Baca didn't run here, the DCCC could have spent some change to boost their preferred nominee, Pete Aguilar, to improve his name rec and in effect "clear the primary field" for him. Even if they didn't do that, Aguilar ran a crappy campaign that didn't sufficiently prevent 3 other Dem candidates from splitting the vote. I feel very strongly we could have won this one without changing the Republicans' actions.
The other race in California is one where recruitment also played a huge role. In CA-21, which was 3/4ths Jim Costa's old district, Costa nonetheless vacated the seat to run in the marginally safer 16th. Had Costa run here he would have cruised, but Democrats could have run now former state senator Michael Rubio or then former state senator Dean Florez who would have been strong candidates, raised a lot of money, gotten DCCC/HMP support, and won easily as Obama carried the seat by double digits. Both of those senators represented a state senate district that was essentially the same as the congressional seat in terms of overlap. Instead we got an ethically challenged some dude who raised barely $100k and got outspent 12:1 and predictably lost big as voters didn't consider him a legitimate candidate.
Florida
Florida is one state where we could have run a ballot initiative in 2010 to create an independent redistricting commission. In that year, two similar initiatives to create fair standards passed the 60% threshold despite Republican opposition and I don't see why we couldn't have also passed one to create a commission. Florida law requires ballot initiatives pertain to one issue only, which is why a 3rd initiative (and 4th for the legislature) was necessary.
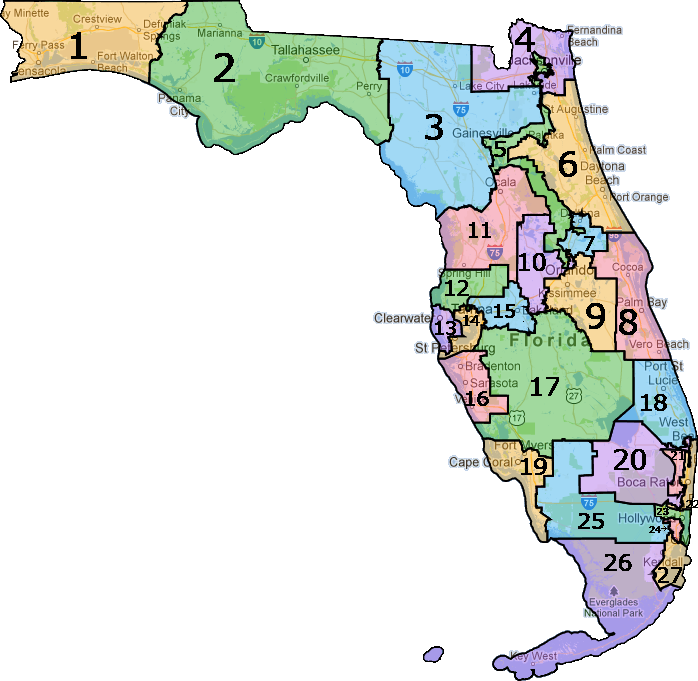
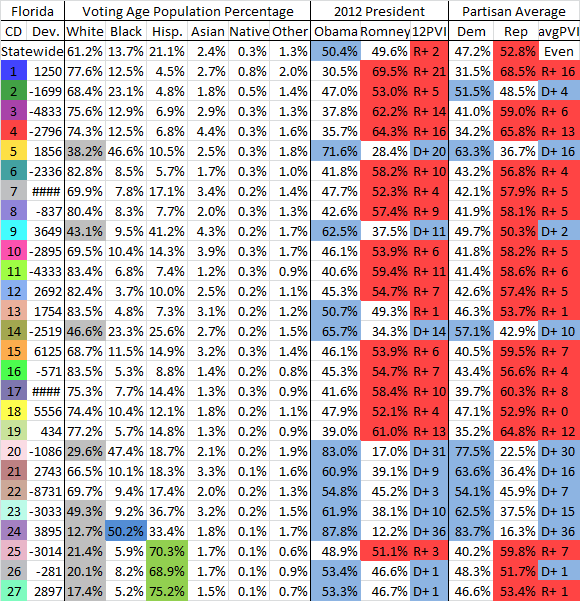
Here we have the congressional map passed by the Republican controlled legislature and signed by deeply unpopular incumbent governor Rick Scott (R). As is typical of (semi) southern states, Democratic votes are already quite heavily concentrated in certain urban areas, but the Florida map does its best to pack Democrats as much as possible into just 7 districts. Particularly grotesque is Corrine Brown (D)'s 5th district, which masquerading as a black minority district, stretches from Jacksonville to Gainesville to Orlando to soak up as many Democrats as possible. Another Democratic vote sink masquerading as a VRA required black district is Alcee Hasting (D)'s 20th district in southeast Florida. Finally, one of the more blatantly gerrymandered districts is Kathy Castor (D)'s Tampa-based 14th district which uses water contiguity to take in St. Petersburg in neighboring Pinellas County to protect long time incumbent Bill Young (R).
What makes this map even more ridiculous is that Republicans claim it adheres to the Fair Districts Amendment that voters passed via initiative in 2010. While Democratic groups have sued and the cases are currently working their way through the court system, there is no guarantee that the current map will get stuck down. Furthermore, even if the legislature is forced to redraw the lines they can still tweak them to favor the GOP somewhat. This should have been totally unacceptable to Democrats and they needed to push for a full-fledged independent redistricting commission.
Florida is a somewhat difficult state to map due to its peninsular shape and dense population clusters so there are many different maps a commission could realistically draw, but here is my best attempt at a map that ignores partisanship and tries to adhere to communities of interest and respecting local boundaries where practical:
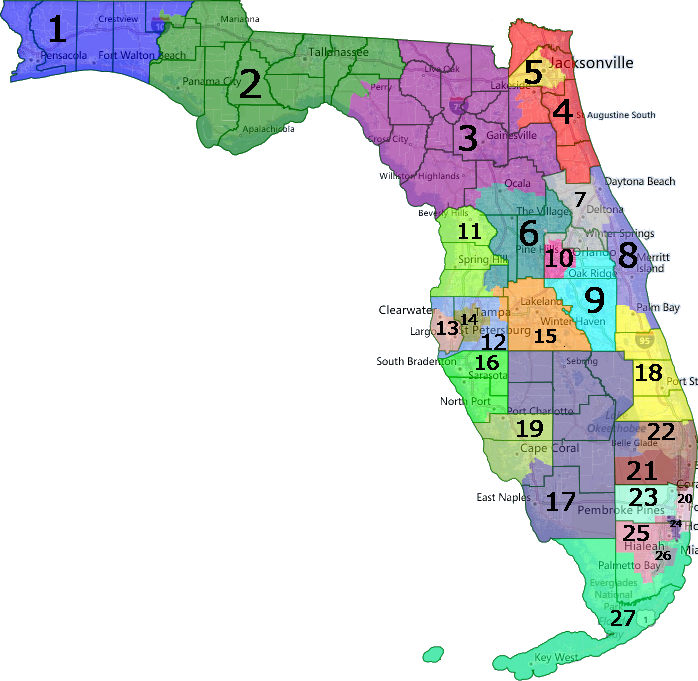
The biggest difference between my map and the currently used one is that I dismantled the flagrantly gerrymandered 5th district. Instead of meandering from Jacksonville to Orlando, it becomes completely comprised of just Jacksonville and some inner suburbs in Duval County. Corrine Brown would hate it, but given how she aided Republicans in trying to defend their own gerrymander in court, I can't muster up much sympathy for her. Make no mistake though, this district like any that Obama carried in the Deep South would be solidly Democratic for a mainstream Democrat and current Jacksonville/Duval County Mayor Alvin Brown (D) would be a fantastic candidate and he has a lot of statewide potential as mayor of conservative Jacksonville anyway. While dismantling the 5th replaces one liberal Democrat with a slightly more moderate one, the payoff is in Orlando where we get a very safely Democratic seat centered on western Orange County. Former Chief of the Orlando Police Department Val Demings (D) ran a great race against christian fundamentalist Dan Webster (R) last year in the 10th district and lost by just 3.5% in that conservative district. Under this map, Demings would easily win this much more Democratic seat and as a great potential statewide candidate, she and Alvin Brown together are well worth trading in Corrine Brown for.
Next comes the Tampa Bay area. The Fair District Amendment was clearly ignored by Republicans here and I've rectified that by adding St. Petersburg back to the 13th. 20-term 82 year old incumbent Bill Young has long been rumored as wanting to retire with the GOP having to prod him every cycle into running again. He only won by 15% last year, his worst showing in 20 years and second worst ever and with his district seeing Obama's margin expand from a narrow 1.4% to a hefty 10.2% I would be very willing to bet he would just retire. 2012 nominee, former congressional staffer and attorney Jessica Ehrlich (D) would be a strong candidate and even if Young doesn't retire would give him the fight of his life and the DCCC would jump in without a doubt.
In addition to the previously mentioned districts, Steve Southerland (R)'s Tallahassee based 2nd district remains competitive for a Blue Dog as Alex Sink (D) won it in her 2010 gubernatorial race and Senator Bill Nelson (D) won it handily last year. Corrupt 16th district Rep. Vern Buchanan (R)'s district also remains largely unchanged and somewhat competitive as we came within 7% of beating him last year.
Moving on to south Florida, I encountered a lot of difficulty deciding how to draw the lines, so view this part map as a general guideline. What should definitely happen though is the dismemberment of the 20th district. Hastings would still have a good chance of winning the primary in any new Ft. Lauderdale district as he has been in congress for 20 years, has had little trouble in the past with primaries, and the district would retain a substantial black population and though no longer close to a majority in the general electorate, blacks would make up either a majority or close to it in the primary. This should allow black voters in the rest of Palm Beach County to have a better shot at electing the candidate of their choice and would have done so to an even stronger degree last year when it was open.
Subsequently, first term Rep. Lois Frankel (D), a newly minted member of the Congressional Progressive Caucus, gets a much safer 22nd district. Unfortunately, at least for the way my particular map turned out, freshman Rep. Patrick Murphy (D), who defeated tea party firebrand and war criminal Allen West (R), gets a 2% more Republican district. Murphy would have lost, even to West, but more likely is that Tom Rooney would have stayed here and the seat would have been safe as there's basically no overlap with the old 22nd. Still, I'll trade this seat for the two of the Orlando and Pinellas County seats as that gets us to plus 1 overall.
Finally, we get to the three Hispanic VRA districts in Miami-Dade County. I'll admit I really had no idea how to draw the lines between the three of them, but given how A) Republicans tried to gerrymander all three to be as conservative as possible and B) all three trended heavily Democratic in 2012 and one sent Joe Garcia (D) to congress, I would have to imagine that either Garcia's seat gets a good deal more Democratic, and/or that one of the two Republicans, Mario Diaz-Balart (R) or Ileana Ros-Lehtinen (R) would get a more Democratic seat. Under my map, Garcia's seat becomes quite safe for him while Diaz-Balart gets an Obama district and the much safer Ros-Lehtinen gets a much more Republican one.
So running a ballot initiative in 2010 could have yielded us +1 seat. However there's one other district where I believe we could have changed the outcome without redistricting and that is FL-02. This is a heavily Blue Dog district where Obama drastically underperformed and even Alex Sink won by 7% in 2010 and Bill Nelson crushed Connie Mack by 11% there last year. Unfortunately, we simply nominated the wrong candidate as this to me seems like a somewhat racist area. Al Lawson, who is black yet not too liberal as far as I know, barely outran Obama despite having DCCC help. The DCCC's preferred candidate, state Rep. Leonard Bembry was a stereotypical Blue Dog holding down a conservative state house seat and would have won if he hadn't lost the primary. So if we could go back last year and nominate Bembry instead of Lawson, this one flips, meaning the candidate changed the outcome.
Illinois
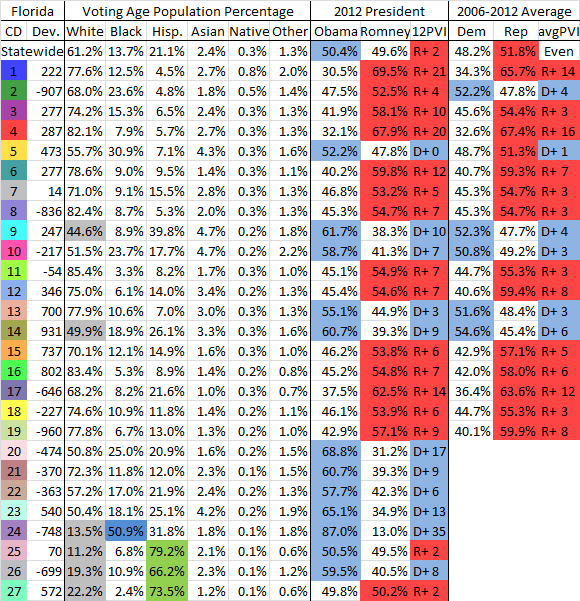
In Illinois, we lost the 13th district by just 1,002 votes due to center-left independent John Hartman taking over 7% of the vote because our nominee, perennial candidate (but decent guy and liberal) David Gill was too liberal for this swing seat. Had we nominated the DCCC's preferred candidate, Matt Goetten we would have carried the district as Rodney Davis won only 46% or so. Another way we could have won this district is through stronger redistricting. While the Democrats' map was largely an effective and aggressive gerrymander, it's possible to boost Obama's percentage here by a point pretty easily and that turns a narrow Gill loss into a narrow Gill win:
Here I've tweaked the 13th district with the parts removed in pink and the parts added in green. Obama's performance is again boosted by 1%, causing Gill to win. I think that these changes are completely within reason assume Illinois Democrats would have gone along with.
Indiana
In Indiana's 2nd congressional district, Republicans gerrymandered it to defeat incumbent Joe Donnelly causing him to retire and successfully run for senate. Given how Jackie Walorski only won by 1.4% despite having a sizable spending advantage over Brendan Mullen, I believe that had Donnelly run here his incumbency would have carried him to victory. If the DCCC had entered the race and or House Majority Pac spent more than $500k here, Mullen likely could have eked out a win.
Kentucky
In Kentucky, five-term incumbent Ben Chandler lost in a bit of an upset after resting on his laurels because his district was shored up slightly.
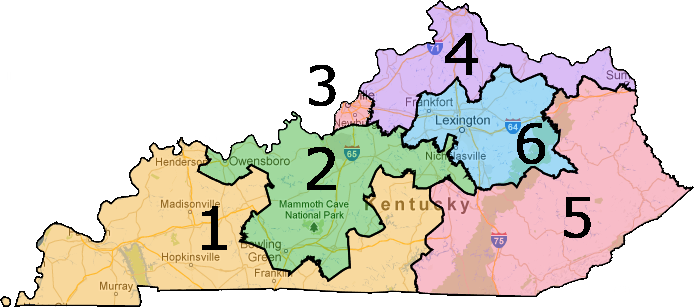
At 5% more Democratic than the state, Chandler had no business losing this district. What caused his loss is quite simple: he voted for Cap and Trade in a district with some coal producing areas in a state that produces a huge amount of it. Subsequently, though Chandler held on in 2010 narrowly, he lost last year when redistricting 'shored him up' by adding normally conservadem coal counties in the east of the district where he drastically underperformed the average. Bruce Lunsford won this district in 2008 and Jack Conway only narrowly lost it in 2010, yet Chandler lost by 4% thanks to Cap and Trade and a crappy campaign. Had he voted against the bill in 2009 and or run a more vigorous campaign, he'd have likely won.
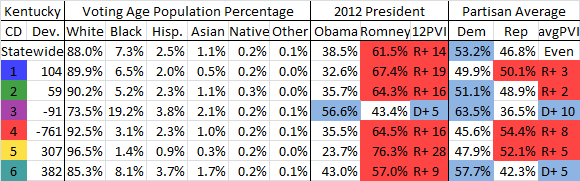
Furthermore, redistricting was not a boon to Democrats here as they explicitly traded the competitiveness (if any) of the 1st and 5th to 'shore up' Chandler. Here's a map that a court might have drawn rather than the legislative compromise:
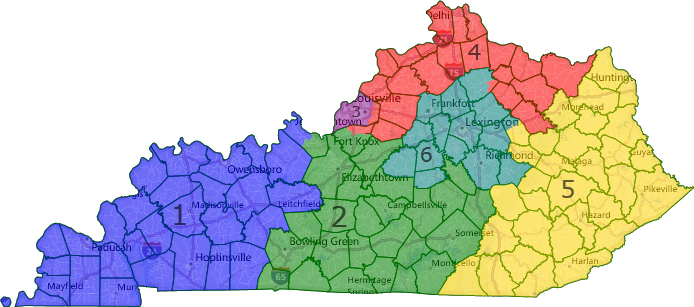
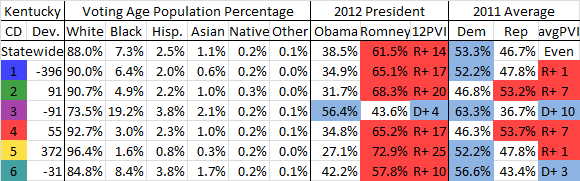
The 6th district gets 1% less Democratic downballot, but because it relies less on coal areas would actually improve slightly for Chandler though he'd have still lost thanks to a crappy campaign (and the cap and trade vote). Ironically the actual map was deemed the "Ben Chandler Lifetime Employment Act" by disgruntled Republicans, yet this court map is either just as good if not better because Chandler didn't run a great campaign and Cap and Trade was fatal.
Maryland
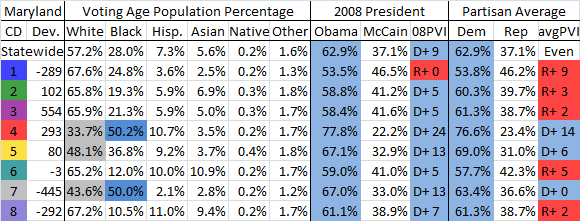
Maryland Democrats drew this disturbingly and unnecessarily convoluted map to produce a 7-1 split and gain them 1 extra district:
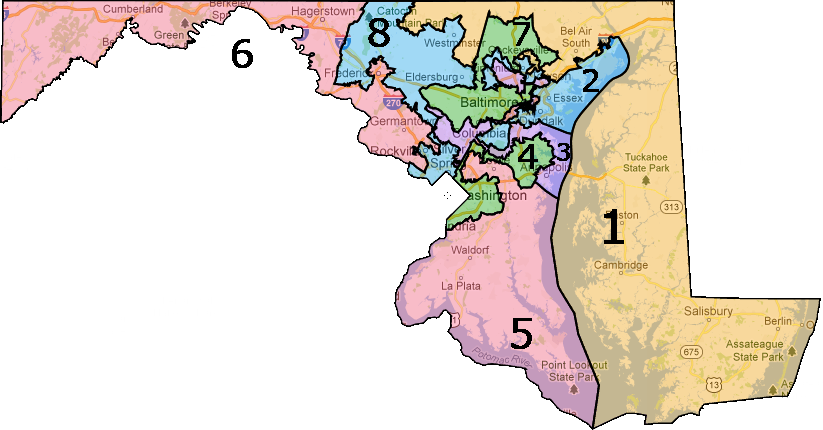
Basically this map was drawn because of the selfish demands of Democratic incumbents, particularly John Sarbanes and Dutch Ruppersberger. Essentially, all the demands placed on the map were as follows:
1) Don't split the eastern shore
2) Don't draw the 1st into Baltimore proper
3) Ruppersberger gets the Aberdeen Proving Grounds (military base)
4) Ruppersberger gets his home of Cockeysville
5) Sarbanes gets his home of Towson, both are in northern Baltimore County
6) Sarbanes gets Annapolis
7) Sarbanes gets some DC suburbs for his future statewide run
8) Hoyer gets College Park
9) 5th district remains a black opportunity district
10) Edwards gets parts of Montgomery County, the only one not obeyed
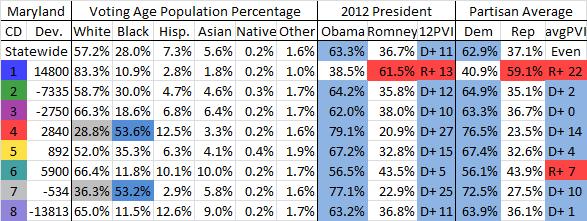
So these demands and in particular Sarbanes' scuttled targeting the 1st as well. But, given how gerrymandered the lines are, it is possible to meet all of these demands while turning the 1st into an Obama district and the answer lies with touch point contiguity, which is legal:
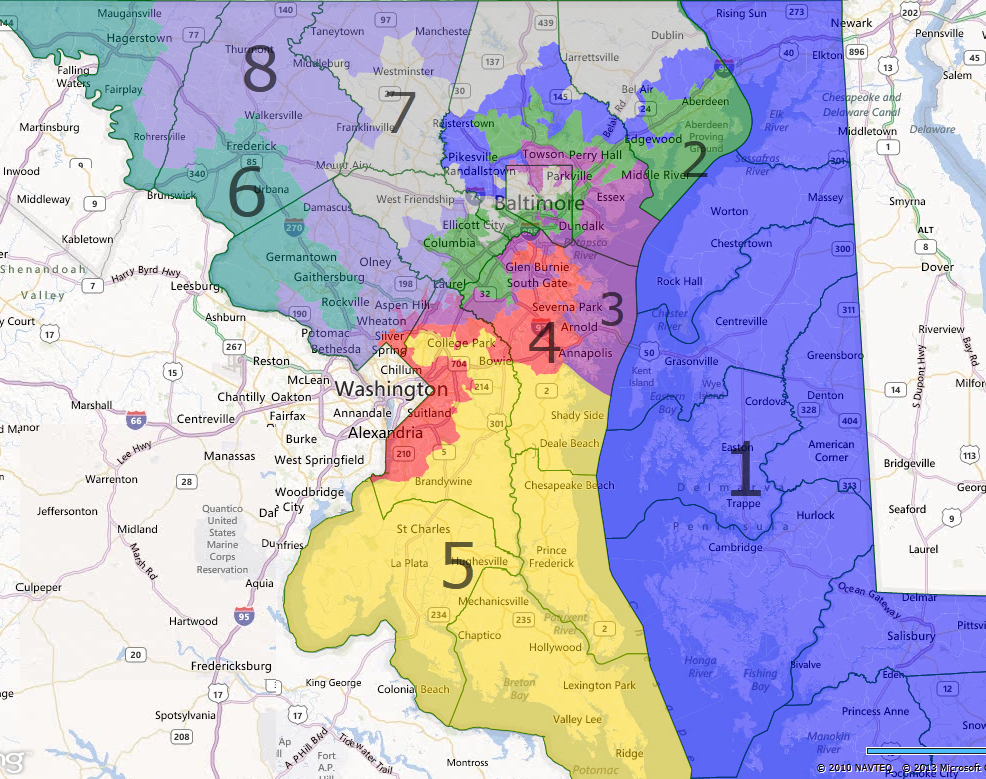
Under this map, largely based on one KingofSpades drew, Democrats could have recruited former Rep. Frank Kratovil to run for a rematch against far right Andy Harris and given how he only lost by low double digits in a 10 point more Reppublican district, and the fact that Obama carried it both times and it trended Dem in 2012, I believe we could have very likely won the 1st. Furthermore though, it's very easy to draw an 8-0 that ignores all of these demands and actually turns the 1st into a district where a liberal could and would win.
Michigan
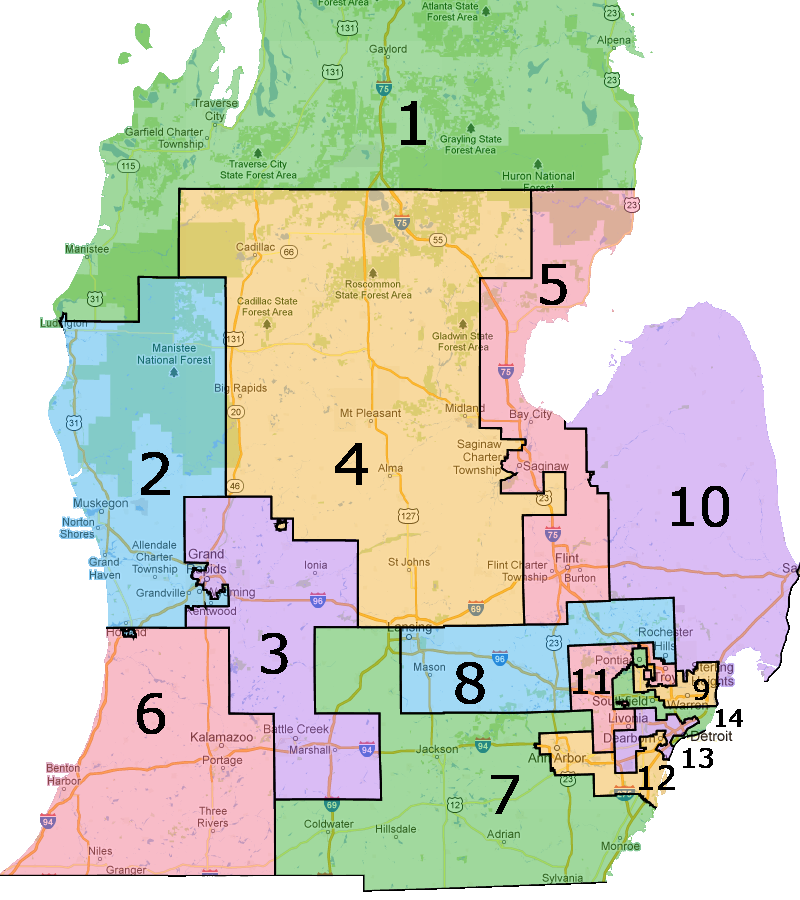
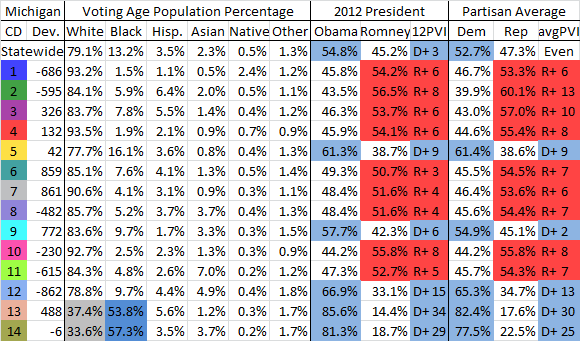
This is the Michigan congressional map (apologies to any Upper Peninsula folks) passed by the Republican controlled state legislature and signed by governor Rick Snyder (R), who recently signed Right to Work for less legislation into law. As should be immediately apparent, southeastern Michigan is a contorted mess. It also very efficiently packs Democrats into just 4 districts, leaving us 5 total while Republicans and Mitt Romney won 9 of the state's 14 districts in a state where Barack Obama won by nearly 10%.
So what might a non-partisan drawn map look like that we could have implemented through a ballot initiative?
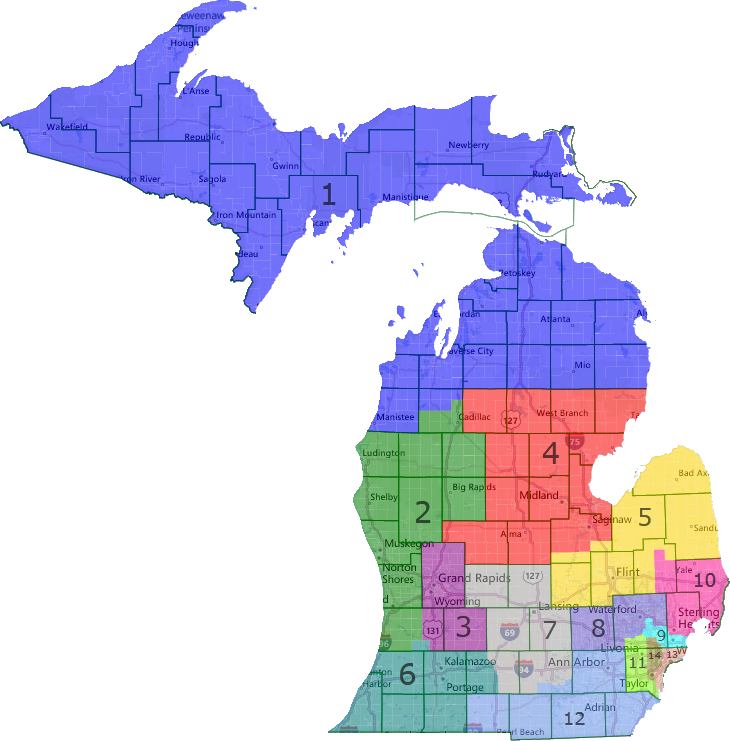
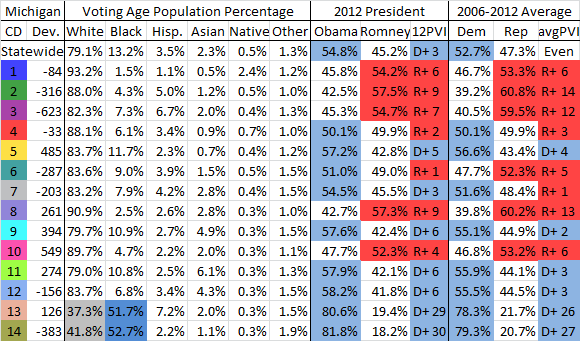
The 1st district remains more or less the same and we really fumbled it by not winning it last year. The 4th and 6th districts though, which had otherwise safe incumbents, get significantly more Democratic to the point where Obama actually carried them last year. We probably wouldn't have won either, but the 4th district in particular is one where Obama relatively underperformed the average and the candidates running where the district lies won 45.3% despite none of its territory being in an actually competitive race last year. We might just have won the 6th though, particularly if Mark Schauer, whose base of Battle Creek is added to the district, decided to run. Upton had his worst showing in a long time last year against a totally underfunded lower tier candidate, yet Democratic candidates won a combined 46% here so it would definitely be within reach.
Moving on, the seats I think we'd actually change the outcome in are without a doubt the 7th and 11th. In the 7th, Tim Walberg gets a Dem leaning district where he'd have likely lost seeing as our underfunded candidates won 47.3% and our bench is incredibly deep here. Had someone such as senate minority leader Gretchen Whitmer run I definitely think she would have won as outside groups like the DCCC absolutely would have targeted Walberg pretty much regardless. Then, we come to the 11th which our Democratic candidates won outright massively and Obama easily carried with nearly 57% of the vote. Given that David Curson, a total stand in candidate, carried a nearly identical if not more Republican district over Kerry Bentivolio in the 2012 special election for Thad McCotters seat, this one becomes a slam dunk, especially if John Dingell Ran here.
The flip side of this is that both of Sandy Levin and Gary Peters get drawn into the same district where either Levin just retires or Peters does before he runs for senate in 2014.
Even disregarding the ballot initiative route though, it's within reason that we could have won the 11th. Thad McCotter had to resign after committing ballot petition fraud and Republicans were left with wacko nutjob Kerry Bentivolio who narrowly beat a rather unqualified candidate Syed Taj. Had Gary Peters, a plurality of whose old district wound up here, run here instead of the safe 14th he'd have won. Regardless though, any stronger candidate would have been able to attract DCCC funding and highlight Bentivolio's history of bizarre and unstable behavior and win.
Nebraska
Nebraska saw the heavily outspent John Ewing come within just 1.6% of beating Lee Terry and I firmly believe that had the DCCC jumped in and HMP spent more than just $100k here, he could have been propelled to victory seeing as Democrats were outspent by roughly 3:1 yet came so close.
Another way would have been a ballot initiative to undo the mild Republican gerrymander.
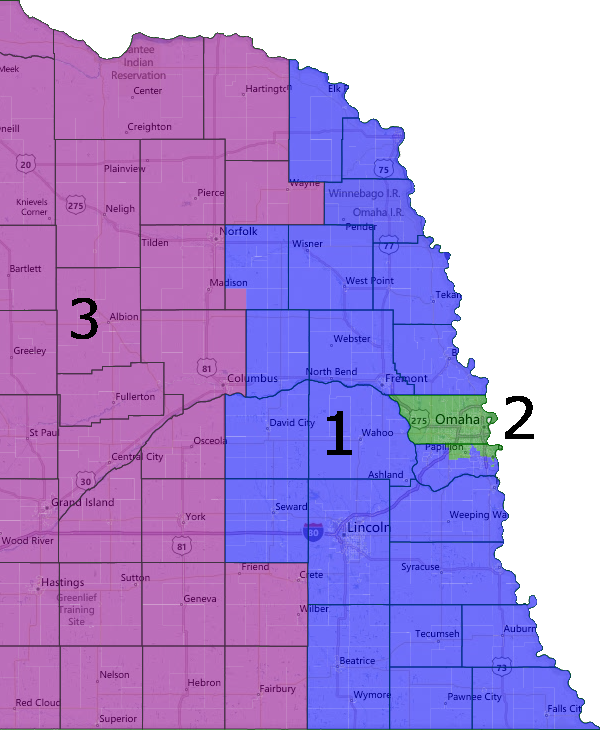
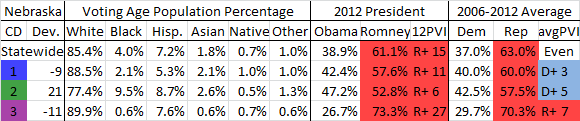
Nebraska saw perhaps the most minimalist Republican gerrymander possible yet it still appeared to have made the difference. The 2nd district is far and away the best for federal Democrats and Republicans made it about 1.6% better for Mitt Romney's margin than this map I've drawn which didn't carve Bellevue and Offutt Air Force Base out from the 2nd in favor of rural Sarpy County. As such, the election would be been a coin flip before the DCCC spent money and in a better district where polling would have showed potential, I think they could have entered here and made mince meat of Terry. Either way, this was a winnable race that the DCCC really dropped the ball on.
New Jersey
New Jersey is a state which, befitting its image of corruption, has a bipartisan commission that normally functions to just protect incumbents. Normally that is, but instead Chris Christie used the power of the purse to threaten the Rutgers program of normal tiebreaker and redistricting expert professor Alan Rosenthal, causing him to drop out of contention. Democrats then foolishly agreed to the replacement of former Republican acting governor John Farmer who predictably sided with the Republican map as tiebreaker. As such, we got a modest Republican gerrymander in yet another blue state.
Had Democrats not agreed to Rosenthal and forced a compromise tiebreaker, it is likely that their map would have been chosen instead or at least forced Republicans to draw a fair fight district too. Dems never released their map, but only described how it would set up a "fair fight" district for Steve Rothman and Scott Garrett as the state lost a district in reapportionment. Here I've drawn just such a district that splits just one township:
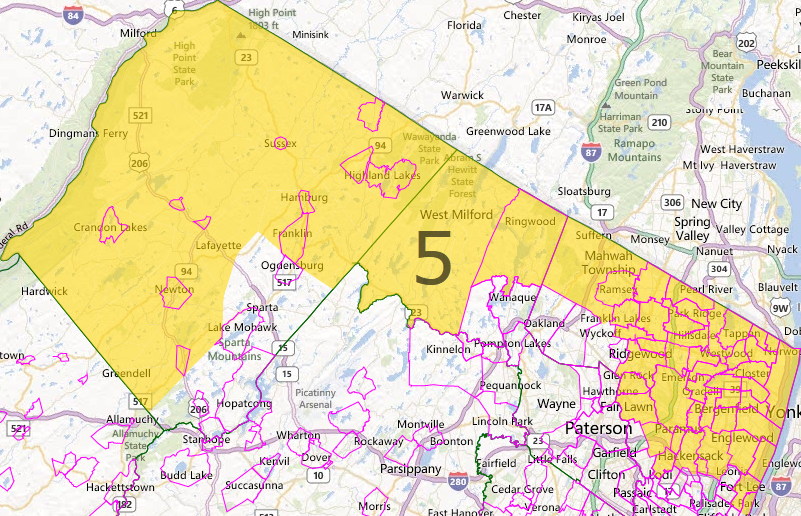
The district went for Obama by 7% last year, though just 5.5% in 2008 making it R+ that year but D+ in 2012. Dem house candidates won by 5% here and I see no reason why Rothman, who was very well funded, would have lost to someone as far right as Garrett (the most conservative northeastern Republican) in an Obama district, making this relatively solid +1.
New York
New York was rather a disgrace when it came to redistricting mainly because Cuomo didn't veto the legislative maps, but that has little bearing on the congressional map as I doubt he could have extracted a Dem map in return for the GOP senate gerrymander. Anyway, the races I think we could have won are the 11th and 23rd districts.
In the 11th it comes down to candidate recruitment as Mark Murphy was a rather poor candidate and couldn't really formulate why he wanted to run in an interview/debate, yet he still came fairly close. Had former Rep. Mike McMahon run I believe he would have won seeing as Obama won the district by over 4, making it D+. Grimm has serious ethics issues and only won by 5 despite outspending Murphy by 2 to 1. Had McMahon run he would have been well funded and seeing as how he lost the same district by just 3% in a 2010 upset, I believe he'd have pulled it off last year.
In the 23rd the DCCC dropped the ball big time and I get that they make mistakes, everyone's human. Our very underfunded candidate got outspent over 2 to 1 and came within 4% of winning. Had the DCCC/HMP invested a cool million here, I believe we could have elected Nate Shinagawa over the incumbent Tom Reed. Hopefully we get a strong candidate this cycle as Reed has so far posted two unimpressive margins in his Republican leaning district.
Ohio
Ohio all comes down to the ballot initiative route, which we should have done in 2011 when unions turned out in force to repeal a signature piece of the Republicans' legislative agenda SB 5.
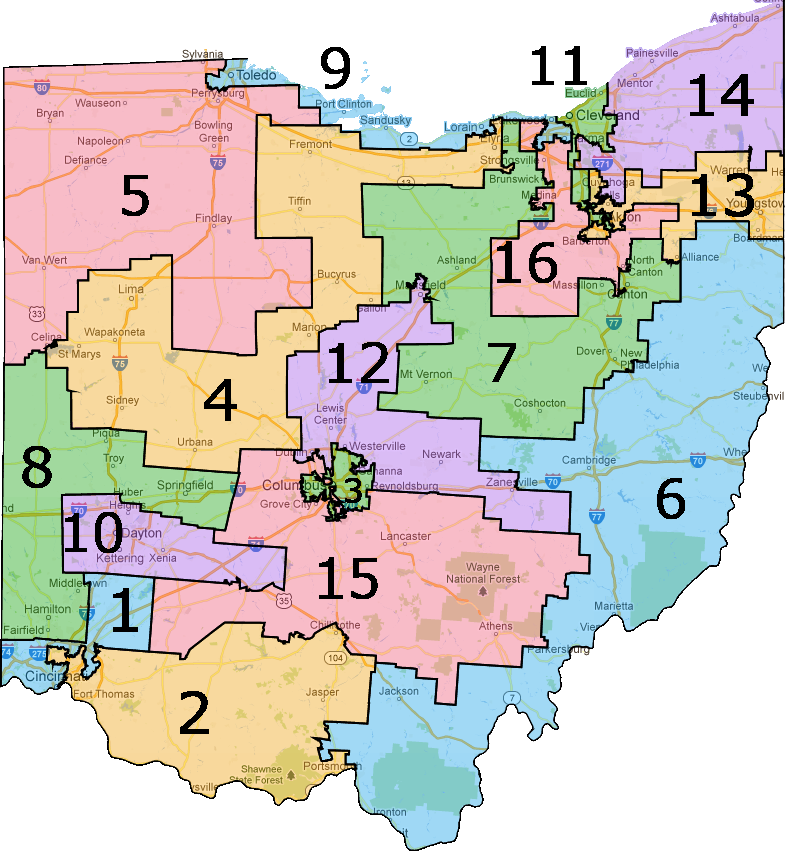
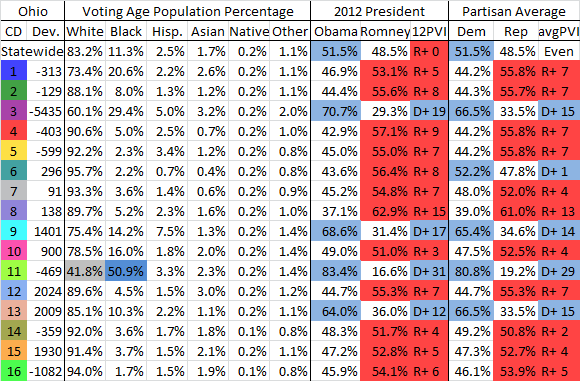
Here is the Ohio congressional map that Republicans and governor John Kasich (R) were able to draw that packed Democrats into just 4 of 16 districts in a state Obama carried. Northeast Ohio is a mess, Cincinnati is cracked, and Toledo is combined with western Cleveland. We were only competitive in two districts other than those we held, but both Betty Sutton and former Rep. Charlie Wilson lost. While there are many ways to draw the state, here is one version I feel is decently plausible:
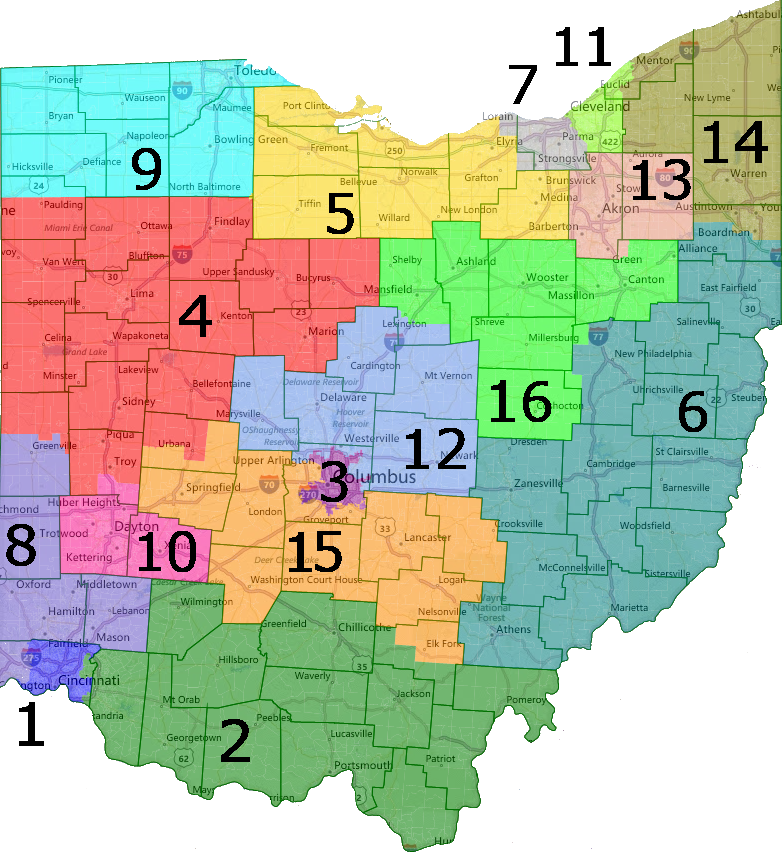
More than any other state, Ohio probably yields us the most seats when we dismantle the Republican gerrymander. This was a state where Dems won roughly half the vote yet got 25% of the seats. So starting off, we have the 1st district which contracts to just Cincinnati and its inner suburbs and goes from a solid Romney district to one where Obama won over 56%. Our total sacrificial lamb candidates won a combined 49% here and if someone like former Rep. Steve Driehaus or Cincinnati mayor Mark Mallory ran this would be a relatively easy pick up against the hard right Steve Chabot. The rest of the southwest and center of the state are relatively the same, but it's the north and east where we have a field day. Without the Toledo to Cleveland Gerrymander, the 9th is unpacked and the 5th becomes a marginally D+ district that we'd have picked up with a competent campaign in the political environment that was 2012; indeed our candidates won 54% there in 2012. The 6th district also moves left enough to be a coin flip for the recently deceased Charlie Wilson (meaning that a special would have been required had he won but that's another story). Wilson lost by just over 6% and the district gets over 3% better and has more of his old base in the form of his state legislative districts in it, which leads me to believe he'd have narrowly prevailed over Johnson and certainly would have gotten more DCCC funding as a strong former incumbent.
Moving onto the northeast, we see the LaTourette-mander dismantled with the northeast corner merged with the Youngstown area. Since LaTourette retired, Tim Ryan would have wiped the floor with David Joyce in this 57% Obama district. Adjacent to it, Betty Sutton's Safe D Akron district is revived where she'd have cruised, while unfortunately Dennis Kucinich, last seen becoming a Fox News contributor and flirting with running in Washington state, gets his West Cleveland district back. Still, even Kucinich would have a hard time losing this 57.4% Obama district though it's not guaranteed he'd have even won the primary. Finally, I emphatically do not believe that the 11th should be required to racially gerrymander its way down to Akron to be majority black. Racial polarization here is far lower than it is in places like the Deep Southern states and at 44% black would still easily allow black voters the ability to elect the candidate of their choice, who happens to be Marcia Fudge (who is black).
Sadly a map like this almost happened with Ted Strickland losing by just 2% in the most heartbreaking loss of 2010, but we could have certainly tried to implement it through ballot measure in 2011 when we won big.
Pennsylvania
PA-12 is the only district I think we could have done anything about for a few reasons. First, we had a stronger more proven incumbent in Jason Altmire who held a similar district in 2010 and represented twice as much of it and for longer than Mark Critz did. Secondly, Critz old district was a good 7% more Democratic downballot, yet they both won by the same margin against quality opponents in 2010. Furthermore, Altmire had 3 terms of incumbency to Critz' 1 and change and political science has shown that the incumbency benefit increases significantly around 3 terms. Finally, while Critz performed far ahead of Obama in the Johnstown area, local Dems usually do much better there than Obama did and Critz just didn't run far enough ahead in the Pittsburgh suburbs part of the district that were Altmire's base. So it's for those reasons and the fact that Rothfus only defeated Critz by 3.4% that I think Altmire would have won had we nominated him.
Virginia
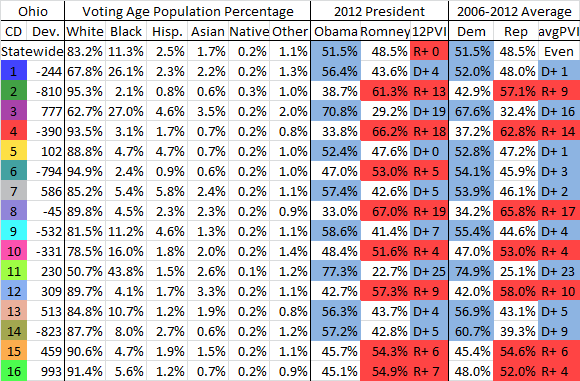
Virginia Democrats just very narrowly lost the state senate in 2011 which allowed Republicans to gerrymander the state like this:
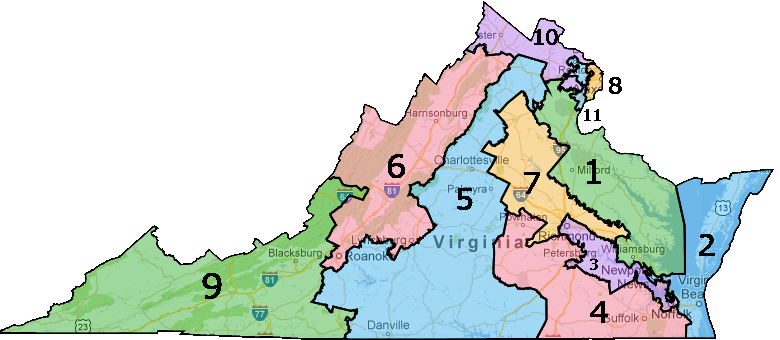
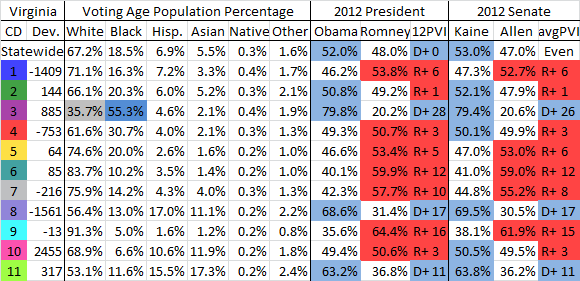
Now looking at the 2011 senate map, Democrats got to draw a mild gerrymander while Republicans drew an aggressive one in the house. Unfortunately though, senator Roscoe Reynolds was more worried about a black primary challenger than the general and specifically excluded some heavily black and Democratic precincts. Given how he lost by just over 600 votes, those precincts would have saved him. Similarly, Creigh Deeds did not want to dilute his district which caused Ed Houck to lose by just over 200 votes. Had Dems been smarter in drawing that map they would have saved their senate majority and produced a court-drawn congressional map like this:
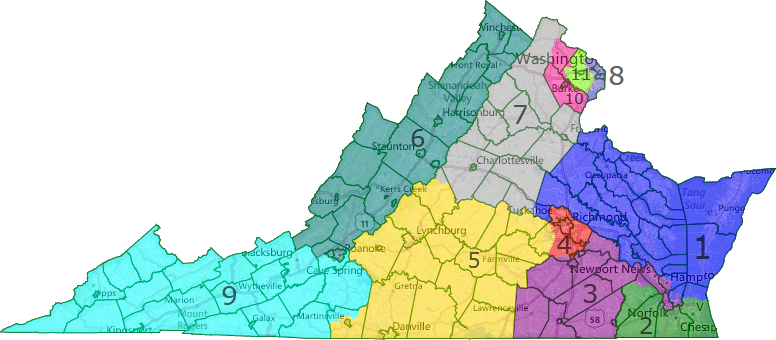
Here, I've dismantled the ugly Hampton Roads to Richmond gerrymander in favor of a compact Richmond seat and compact Hampton Roads + Southside VRA district. I admit I'm not entirely sure how a commission might draw this area as it's possible that the 2nd district, which here is roughly Lean R, could get either more or less Dem. Either way though, we'd get an extra safe seat out of Richmond. The 2nd would also make for an awesome fight between evangelical fundie Randy Forbes and 'RINO' Scott Rigell. At 49.2% Obama it's not inconceivable that we might have defeated Forbes, but I'm not particularly hopeful here as it's possible the seat could get more conservative depending on how Hampton Roads is drawn.
In Northern Virginia, Frank Wolf, who is getting up there in years and might have retired in favor of state legislator Barbara Comstock, gets a 56.3% Obama seat where Kaine likewise won a similar percentage. Dem House candidates actually carried the district, and while Wolf is a strong incumbent he has also not faced a serious challenge in a long, long time and has nothing but a conservative voting record and the seat is roughly half new to him, diminishing his incumbency. Not a single Republican won a district where Obama did that well last year and I think we'd have knocked off Wolf with a well funded nominee and cruised here if he retired. Gerry Connolly keeps his safe seat though it's less packed, but Eric Cantor gets absolutely screwed by dropping his conservative white Richmond/suburbs base and gaining Charlottesville (where the hell else would you put it?) in a district that voted for Obama in 2008 but Romney carried by 4% in 2012. If Cantor is the Republican nominee, we carry the district plain and simple, but I'd imagine he just retires or runs in the 5th as he knows he's toxic in a swing seat. Luckily for Democrats, we have a fantastic candidate who nearly won a district 2% redder in 2010 of all years and whose entire base is in the district: none other than Tom Periello. I feel pretty good about us winning this district anyway as it only narrowly voted for George Allen despite his old congressional district and electoral base having very significant overlap with it.
The 5th gets much more Republican, as does the 1st to the point that they're unwinnable. Overall, this map is probably plus 3.
Washington
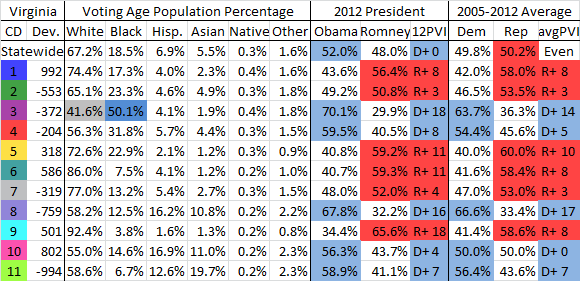
Here we have another state with a bipartisan commission and unlike in New Jersey, where the tiebreaker voted with Republicans to screw over the Democrats, here we just had a Democrat vote with Republicans to screw over the Democrats. This is largely because, even more so than the New Jersey commission, the map was pure incumbent protection and after 2010, incumbent protection has a GOP bias.
Had Democratic commissioner Tim Ceis not voted for the Republican plan, the map would have gone to the state supreme court. So here's what my best guess as to what they or a California-style commission might draw. Note that districts 3-5 are all pretty much the exact same as the actual map.
The difference though comes in the Sound districts with the 6th dropping Tacoma in favor of Olympia and the 8th dropping Pierce County. I see no reason why it should have Pierce in addition to Seattle suburbs and with that it goes up to 58% Obama and dooms Reichert, the main difference in the map. Unfortunately though the 10th becomes just mildly Dem leaning, but Denny Heck performed very well in a redder seat in 2010 and I have no doubt he'd have won here last year. Finally, the 1st and 2nd switch partisanship largely by becoming more similar to their prior configurations, meaning that Suzane DelBene would have taken on Reichert in the 8th and someone else would have won the 1st. Obviously there are many ways to draw King County, but it is by dropping Pierce that Reichert is doomed.
Bonus, Better Massachusetts and West Virginia Gerrymanders
Both of these states were Democratic drawn and while a better map wouldn't have gained us more seats (though in West Virginia it's debatable but risks a dummymander), it certainly is possible to do more to shore up our vulnerable incumbents, John Tierney and Nick Rahall.
Massachusetts
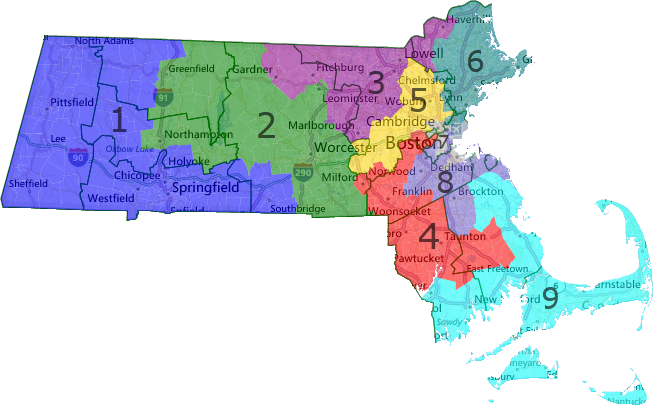
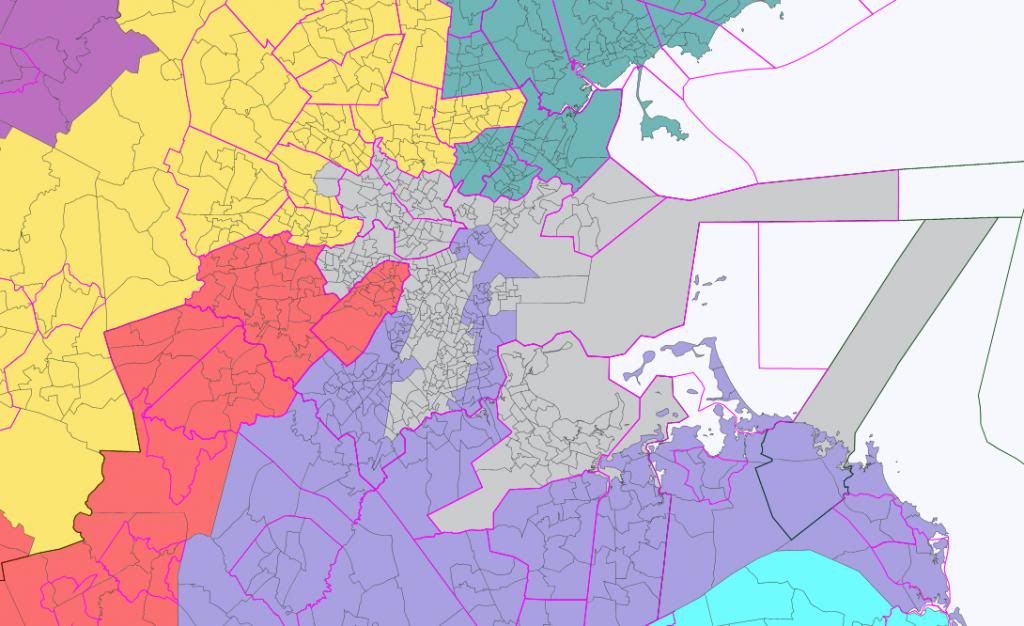
John Tierney barely eked out a 1 point victory last November, so here I've given him a 3% stronger district. I've also bumped up the 9th so that every single seat is over 57% Obama which should make them all very safe.
West Virginia
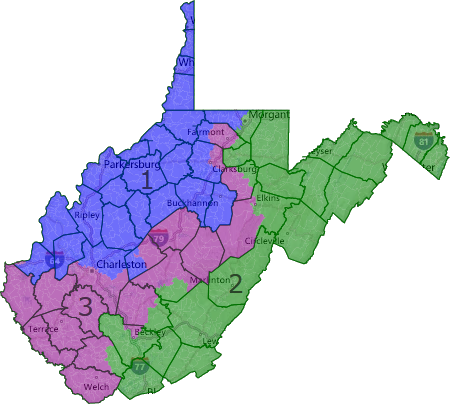
West Virginia has been trending towards Republicans at the federal level for a while and unlike Massachusetts, the legislature didn't even bother drawing a partisan gerrymander at all. Here I've shored up Nick Rahall's 3rd district by about 4.5%. Though Obama won just 40% here, he only lost it by a point in 2008 and John Kerry actually won it by 3% in 2004. Not a single other Democrat was held below 57% here and that's what Rahall would probably have gotten. With the addition of more urban areas this district might even last the decade if the trend starts to translate downballot. So if Nick Rahall loses reelection narrowly at some point, that will be one more seat we cost ourselves through not gerrymandering as aggressively as Republicans.
Conclusion
So there's a strong case to be made that Democrats, through foolishness, lack of aggressiveness, or a combination of both, could have retaken the House by just making better decisions on our own. Overall I have 20 likely seats that could have changed and an additional 7 that could have changed with the power of the ballot measure. Hopefully Democrats in those ballot measure states will take heed and fund efforts to re-redistrict in a non-partisan manner.

