In this diary, we will preview the Democratic caucuses to be held tomorrow in Nevada, overview Nevada's demographics and how delegates are allocated both statewide and across Nevada's congressional districts, and make projections based on my Democratic primary model. Then we’ll update the model's projections on a nationwide basis, taking into account the wave of new state and national polls that have come in over the past few days.
Note: I plan to do another one of these for South Carolina before it votes, so be on the lookout. And then of course… Super Tuesday!
Nevada Caucuses Preview
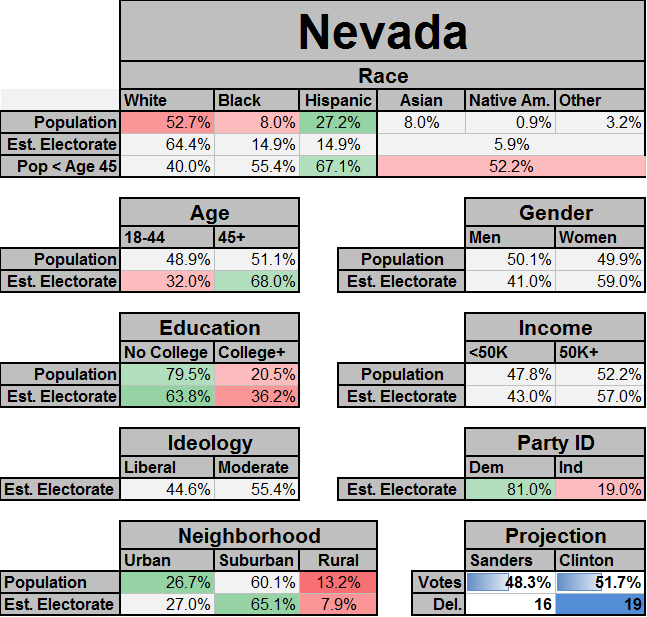
Overall, my model predicts that Clinton will narrowly win the Nevada caucuses by about 51.7% to 48.3%, with Clinton winning Nevada's elected delegates 19-16. This is based on state polls, national polls, 2008 exit polls, census data, and some other data as well (see the links to previous posts at the bottom for more information).
 Vote and Delegate Projection for Nevada: Note you can also see this for all other states in more detail at the bottom.
If Clinton wins statewide, she will almost certainly win NV-01. NV-02, NV-03, and NV-04 are all very likely to split their delegates evenly. Only if one candidate wins a New Hampshire sized landslide will that not be the case. That means that realistically, if Clinton wins she will win 19 delegates to 16. Whereas if Sanders wins, he will most likely only win 18-17 because of the delegate math — unless he wins a surprise landslide.
Clinton's real advantage in Nevada is probably less that it has a lot of Hispanics than that it has a relatively large African American population — the largest of any western State. The western states that vote later in the calendar are all more demographically favorable for Sanders; Nevada is (demographically speaking) likely Sanders' least hospitable state in the west.
Non-Whites
In Nevada, we'll get our first good idea of how non-whites, and particularly Hispanics, are breaking. But Nevada also has a large African American population — larger than any other state in the West. We will start to see how much of a difference there is between how African Americans and other minorities vote. In Iowa, Sanders did surprisingly well in the most heavily Hispanic precincts in the state — which Sanders mostly won. We’ll see if Sanders can make similar inroads among Hispanics and other non-white voters in Nevada, or if minorities will back Clinton as strongly and monolithically as her campaign claims that they do.
Nevada State Polls
Nevada is a difficult state to poll in general, and caucuses are even more difficult to poll. Most pollsters have ran away in fear, and only 3 have dared to send a poll into the field at any time in 2016. They are:
| Poll |
End Date |
Clinton |
Sanders |
| Gravis |
2/15 |
53 |
47 |
| CNN/ORC |
2/15 |
48 |
47 |
| TargetPoint (R) |
2/10 |
45 |
45 |
So this limited state polling points to somewhere between a tie and a narrow Clinton lead. But these polls could well be substantially off. State polls get 68% of the weight in my model's Nevada prediction (given the number, recency, and quality of the polls). Nevada polling from Morning consult and earlier polls are also taken into account by the model, but with lower weight.
Nevada Demographics
The other 32% is based off of demographics, national polls, and 2008 exit polls. This other 32% of the model is more favorable to Clinton than the state polls. This part of the model expects that Clinton should be leading in the Nevada state polls by about 51-41, and that she should win Nevada by a larger 55-45 margin, given that she is ahead in national poll averages by about 7% (roughly 49-42).
First I'll paste in Demographic information for the nation as a whole, then we'll see how Nevada compares:
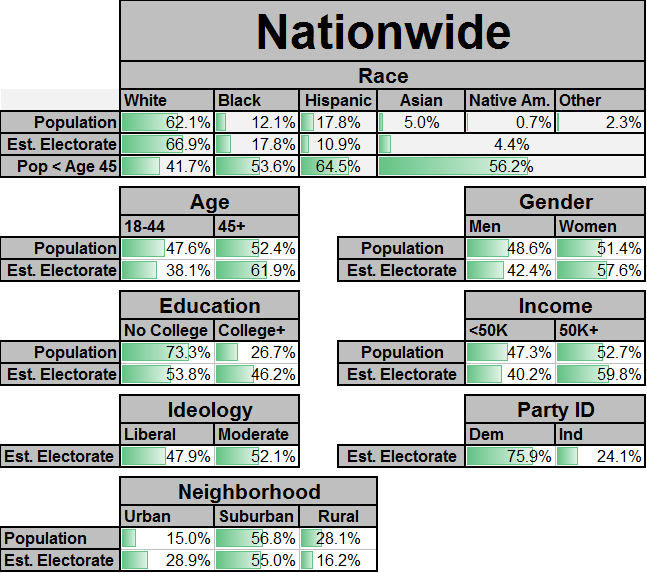
And demographic information for Nevada is shown in the chart below. When something is highlighted in red, that means that it is less than the national average. When it is highlighted in green, that means it is more than the national average. The more dark the highlighting, the more sharply that demographic category deviates from the national norm:
The "Population” data comes from Census 2014 population estimates. This reflects the Voting Age population (age 18+) where possible, but in a few cases is for the general population. The "Estimated Electorate” data comes from the 2008 entrance polls of the Nevada caucuses.
-
Race — Nevada's White and African American populations are less than the national average, and Nevada's Hispanic population is larger than the national average. However, at least in 2008, the racial makeup of the Nevada caucus electorate was pretty similar to the racial makeup of the Democratic primary electorate nationwide. It was a bit more Hispanic and a bit less African American than average, but not far off.
-
Age — The age profile of Nevada’s population matches the country as a whole. There are differences in age by race, however — Hispanics in particular tend to be much younger than whites. 67.1% of Hispanics in Nevada are under the age of 45, which is even more than nationally. But the Caucus electorate in 2008 was substantially older than Nevada’s population. If only 32% of caucusgoers are under the age of 45, as in 2008, that will tend to help Clinton and to hurt Sanders.
-
Education — Fewer Nevadans have college degrees than do Americans nationwide. That also (probably) translated into the 2008 caucus electorate. Entrance polls for Nevada did not ask about education, so I estimated this using a GLM model based on the proportion of Obama's 2008 general election vote that came from voters with and without college degrees. I followed the same procedure to estimate demographics of the electorates for states that did not have any exit polls.
-
Ideology, Gender, and Income — These are all similar to the national average.
-
Party ID — Whereas about 24% of the Democratic primary electorate nationwide in 2008 was self-identified Independents, only 18% of Nevada 2008 caucusgoers were self-identified Independents. That will tend to help Clinton and hurt Sanders.
-
Neighborhood Type — Nevada's population and Caucus electorate is actually less rural than the US as a whole. Although it is a geographically large state, most of its land area is sparsely inhabited desert.
I am not trying to predict how the makeup of the electorate will be different as compared to 2008, because there are too many different factors to consider. Some would likely benefit Sanders, others would likely benefit Clinton. These apply to Nevada, but also to all other states. For example:
- Nevada’s non-white population is larger than in 2008. So it is highly probable that the electorate will be less white than in 2008, and that will likely tend to help Clinton. Nevada in particular is the most rapidly diversifying state.
- On the other hand, most of that diversification is among Hispanics and Asian Americans. It is not at all clear that Clinton has the same sort of advantage with Hispanics, Asians, and Native Americans as she does with African Americans — in fact, what evidence there is tends to contradict that idea.
- Hispanics in Nevada are even a bit younger than are Hispanics nationwide.
- African American turnout may be lower without Obama on the ballot.
- On the other hand, African American turnout had been increasing even before 2008, the African American voting age population is increasing, and the African American population is gradually aging (meaning higher turnout).
- The population is generally aging, so we should expect that young voters will normally make up a bit smaller share of the electorate than in 2008. That will likely tend to help Clinton.
- The share of Americans that self-identify as Independents has been going up for years. That will likely tend to help Sanders.
- The share of Democrats and Democratic-leaners who self-identify as liberal has been going up. That will likely tend to help Sanders.
Your guess is as good as mine as to how all of that plays out. So instead of trying to take all of these factors into account, I am just using 2008 entrance polls (for Nevada) and exit polls for the rest of the country. That is simple, transparent, and easy to understand.
Demographics and Vote by Congressional District
17 of Nevada's delegates are assigned on the Congressional District level.
- NV-01: 5 Delegates
- NV-02: 6 Delegates
- NV-03: 6 Delegates
- NV-04: 6 Delegates
At least in Nevada, the gods of delegate allocation decided to smile on Hillary Clinton — the only Congressional District with an odd number of delegates also happens to be the districts which is quite demographically favorable for her (NV-01).
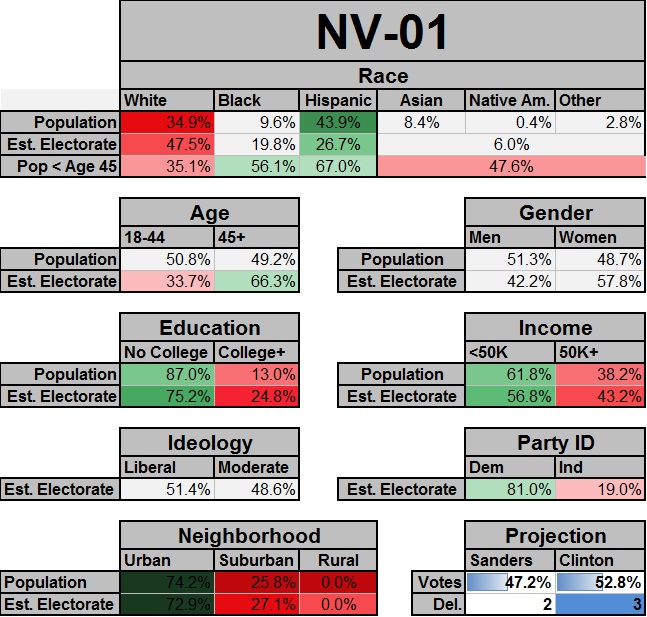
NV-01
NV-01 includes central Las Vegas and the strip, and is a majority minority district which should favor Clinton. At 43.9% Hispanic, NV-01 is much more Hispanic than the nation as a whole, and this should be true for caucusgoers as well. While the African American population is only 9.6%, it punches well above its weight (because of low Hispanic turnout) — about 19.8% of caucusgoers here in 2008 were African American (2 points more than the national average). The low numbers of self-identified independents should help Clinton as well. So if Clinton's strength among minority voters is anything like what it is made out to be, she should win this district easily.
The one thing Sanders has going for him in NV-01 is that people (and voters) there tend to be solidly working class, and Sanders fared well with lower income and lower education voters in Iowa and New Hampshire. Of course, that is not unrelated to the fact that it has a high non-white population, and non-whites have less educational opportunity and income than whites.
So unless Sanders wins an unexpected and unexpectedly strong statewide victory, NV-01 should give 3 delegates to Clinton and 2 to Sanders. If Sanders does nonetheless win here, that means that he made some very serious inroads among non-whites and Hispanic voters in particular. A strong showing here for Sanders could also be reflective of support from rank and file union members on the strip.
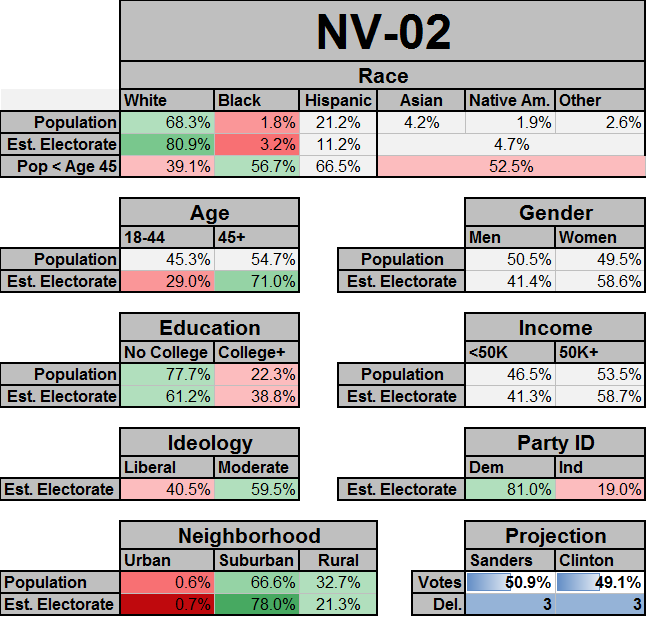
NV-02
NV-02 is concentrated in the north of the state around Reno and Carson city. This should be the the best district for Sanders. It has a high white population and a low African American population. However, the electorate here is older, which could hurt Sanders. But regardless of who wins, the delegates will split 3-3 unless either candidate gets more than 58.33%.
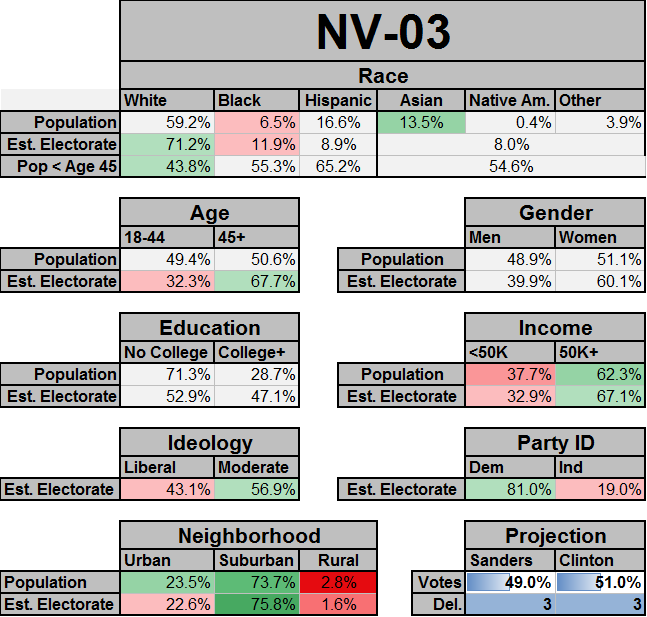
NV-03
NV-03 includes Henderson and the suburbs on the south side of Las Vegas, and should be the second best district for Sanders. It is a bit whiter than average and a bit less African American than average. In addition, the white voters here are younger on average than whites are in the US overall, which should also help Sanders. Also worth noting, it has a bit more Asians than the national average and is a bit higher income than average. Still, the model projects Clinton should do well enough here to edge Sanders (with support from higher income voters, independents, moderates, suburban voters, etc).
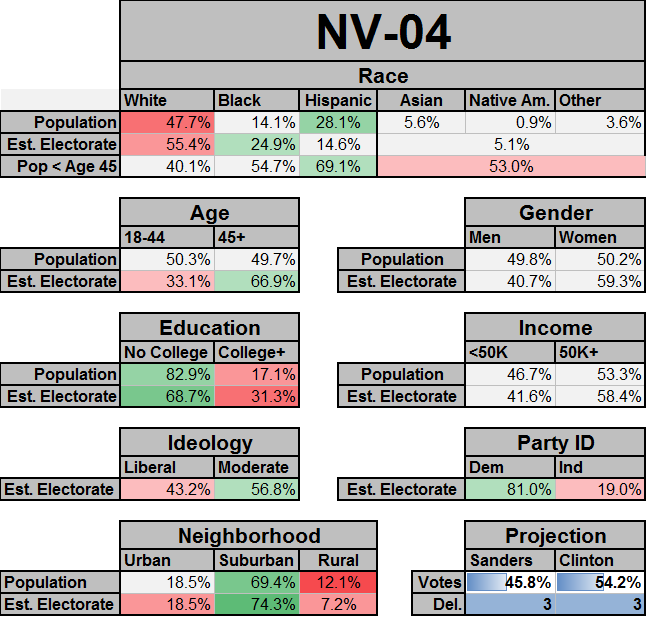
NV-04
NV-04 is centered on North Las Vegas, and is likely to be Clinton's best district in the state. It has the highest African American population in Nevada. About 1 of every 4 caucusgoers is likely to be African American — substantially higher than the national average. It also has a large Hispanic population. There is actually a chance, if Clinton does well, that she could win a 4-2 delegate split here. But to do that, she’d need 58.33% of the vote here.
In sum, the model projects a close race with a slight advantage for Clinton. Nevada's demographics also suggest that Clinton should win — the demographic/national poll portion of the model thinks she should do better than the state polls do.
But Nevada is probably the single most difficult state in the country for which to predict election results. So Sanders could also easily win. And we should not forget that he outperformed polls in Iowa and New Hampshire. Perhaps he will do the same here.
The delegate math favors Clinton — if she wins narrowly, she’ll likely get a margin of 3 delegates. Whereas if Sanders wins narrowly, he’ll likely only get get a margin of 1 delegate.
National Democratic Primary Model
Next we'll update the national Democratic primary model. This incorporates all of the new national and state polls, including PPP’s massive barrage of polls, the numerous polls from South Carolina, and a few other state polls such as the new poll of Colorado showing Sanders up 49-42.
National poll averages currently have Clinton up by about 49-42 (or maybe 48-42 if you prefer RCP to Huffington Post). I also took a stab at taking house effects and poll type (internet vs live phone vs autocall) effects into account, and after doing that also ended up at 49-42. So if that reflects the true state of the race nationally, that probably breaks down about like this on the state level:
49% Clinton — 42% Sanders (current national poll averages)
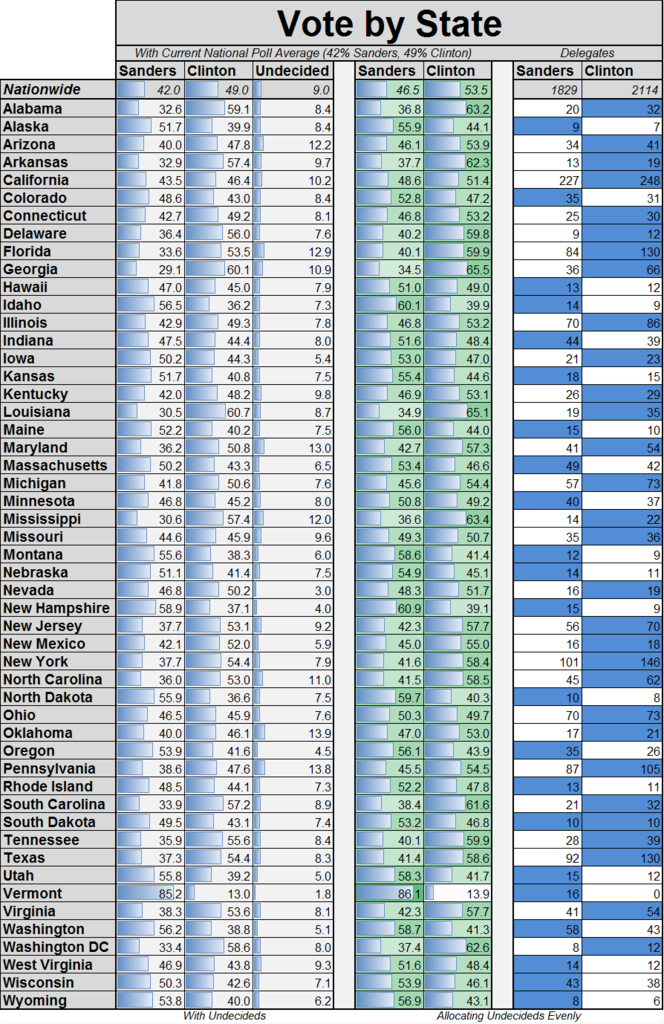
Note — I was going to try to post this in a way that it was electronically manipulable and sortable (rather than as an image), but haven't had time and need to publish this. So I’ll work on that.
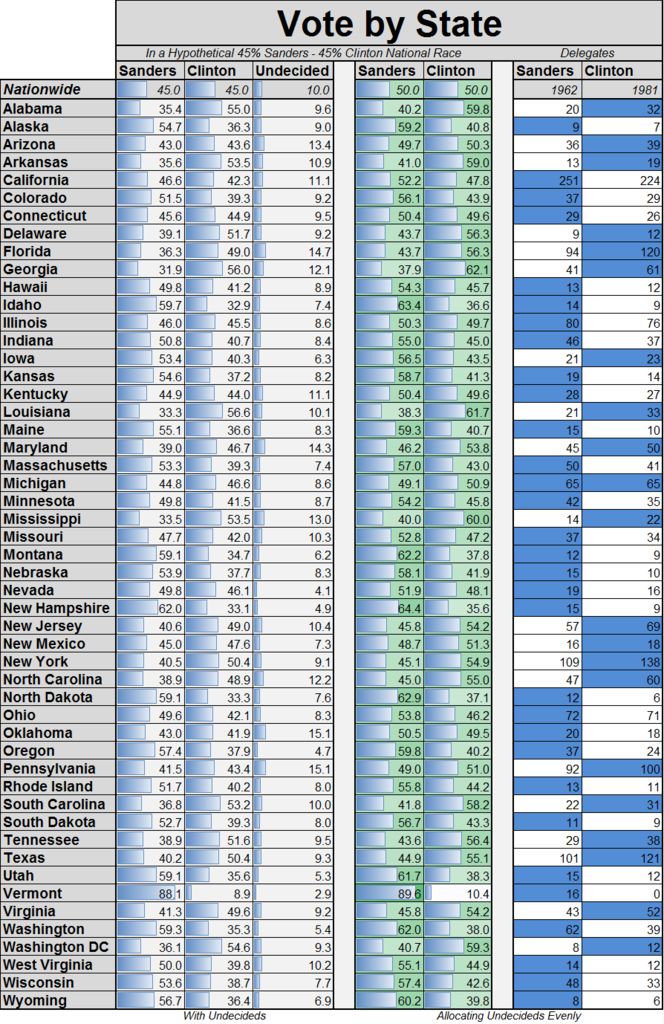
Now what about a hypothetical national dead heat? If Sanders wants a shot at winning the nomination, eventually he'll have to draw even with Clinton nationally. What would that look like?
A Hypothetical National Dead Heat
Nate Silver recently came out with something quite similar to this, outlining the general path to victory for Bernie Sanders. He used Morning Consult's 50 state polls as a starting point (which I found a week ago), and then added to that. Broadly, his model’s predictions are fairly similar to mine, but his model takes less data into account than mine does. For example, he conflates all non-whites together rather than separating out Hispanics, African Americans, and other non-whites. That is also probably why he has Sanders doing less well in the Southwest than I do.
But he does also take into account two things that I do not take into account — facebook likes and campaign donations. My model, on the other hand, is entirely based on state polls, national polls, 2008 primary and general election exit polls, census data, and a few other things.
Anyway, my model's projections are this:
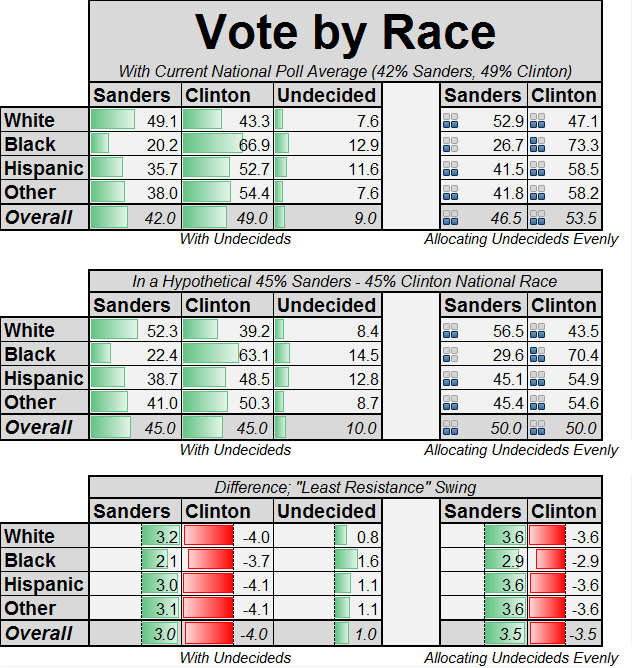
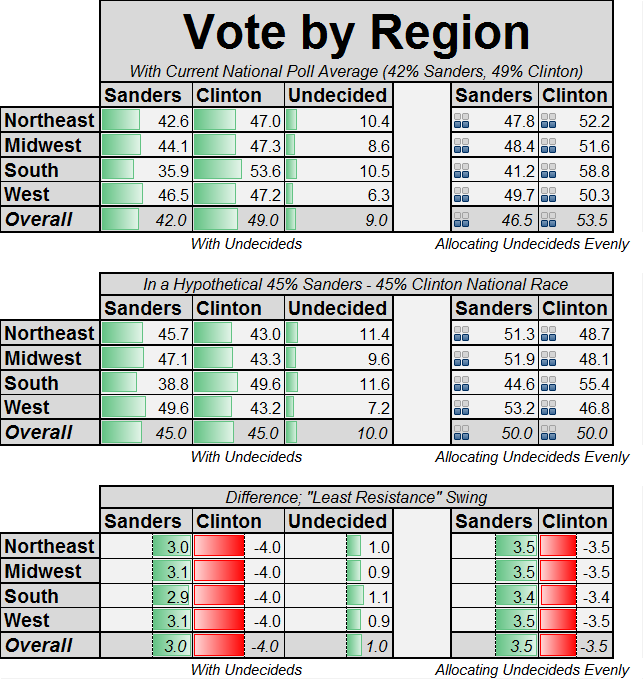
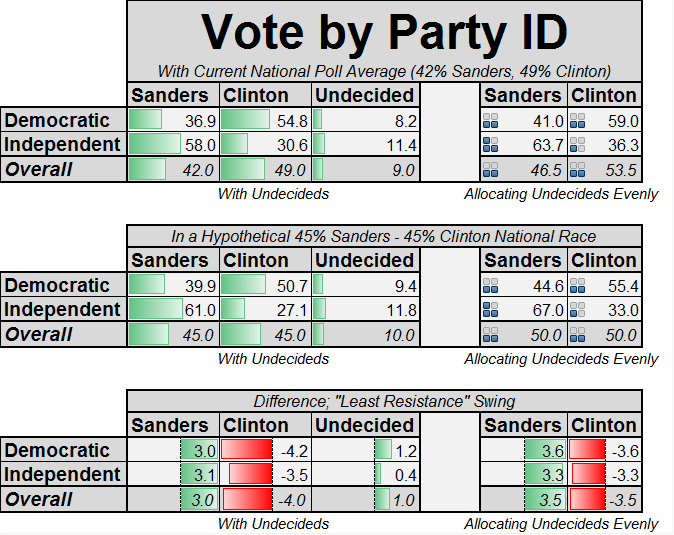
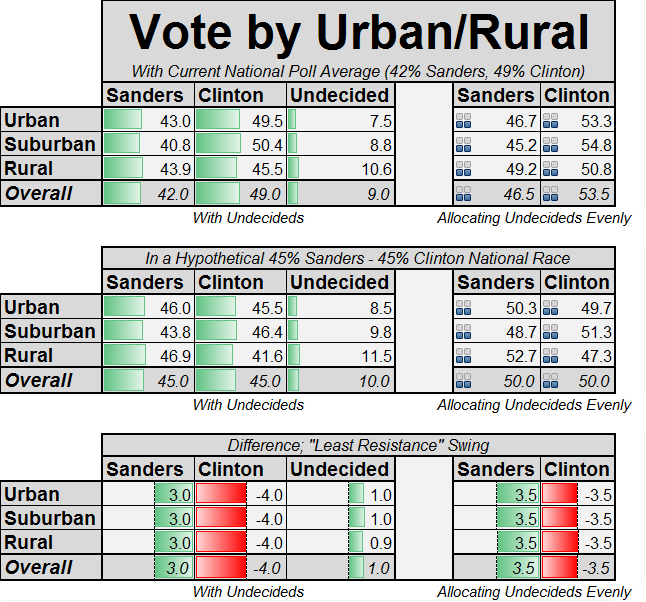
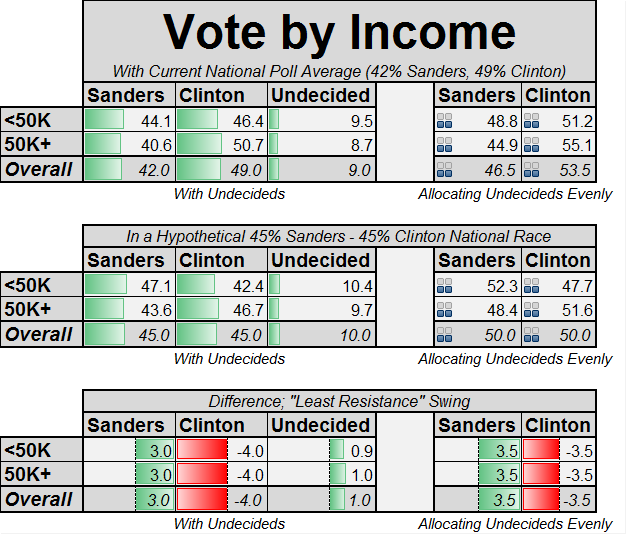
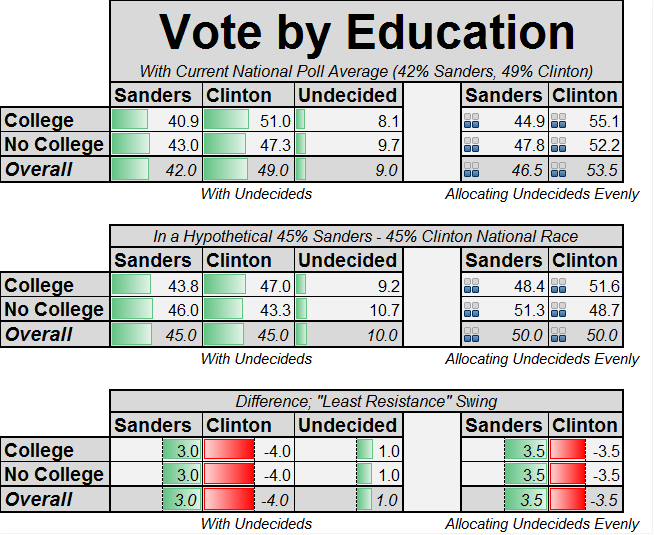
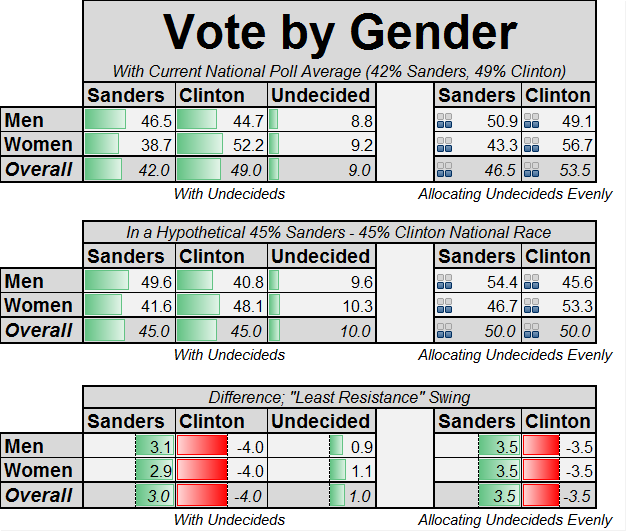
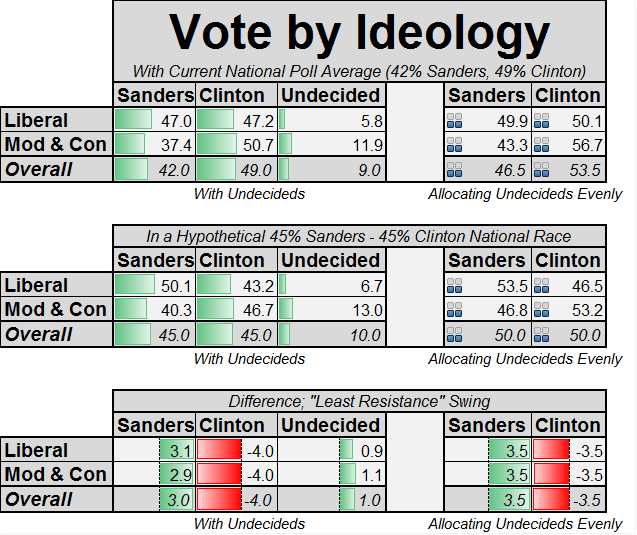
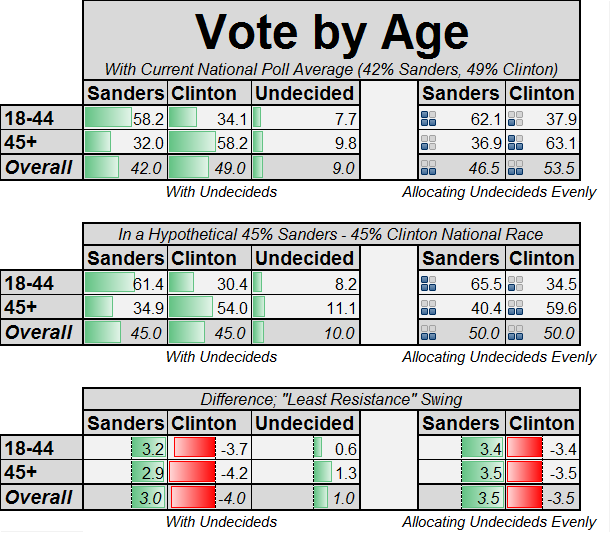
Projected National Vote by Demographic:
Based on crosstabs from 35 national polls since November, on Iowa and New Hampshire exit polls, and on demographic information from 2008 Democratic primary exit polls, here are estimates of how the vote is currently split by major demographics:
Vote by Congressional District:
Finally, I have complete breakdowns of the projected vote and delegate splits for every Congressional District. They are big images, so you’ll have to click on them or on the link to see the full sized behemoths below:
For a 49-42 National Race
Click here or on the image, and it should open a full sized version.
For a 45-45 Dead Heat
Click here or on the image, and it should open a full sized version.
This is a continuing part of an ongoing series using polling data, past exit poll data, census data, and other data sources to analyze the 2016 Democratic Primary.
Previous posts are:
- Poll Meta-Analysis: The Bernie and Hillary 2016 Coalitions, and how they compare to 2008 Obama/HRC
- Poll Data Analysis: The Current State of the Democratic Primary
- How the delegate math shakes out for Bernie and Hillary down to the Congressional District level
- Bernie Sanders Did Much Better With Non-Whites In Iowa Than You Think
- Democratic Primary Model, Feb 8 Update (Pre-NH)
- Democratic Primary Model, Feb 9 Update (Pre-NH)
- Democratic Primary Polls for All 50 States
For more detail on how delegates are allocated across different states, check out this excellent resource from Torilahure.


")


 reacts during a caucus night party February 1, 2016 in Des Moines, Iowa. Sanders was trailing former Secretary of State Hillary Clinton late in the Iowa Democrat")


")


