Math matters. Lots of outcomes rest on its simple precision.
Or lack there of.

(CNN) -- NASA lost a $125 million Mars orbiter because a Lockheed Martin engineering team used English units of measurement while the agency's team [NASA] used the more conventional metric system for a key spacecraft operation, according to a review finding released Thursday. [Sept 1999]

Math is what holds gravity at bay -- when it's Right, that is.
Here's another example that shows how Math Matters. Those Wall Street wizards who assumed the off-loading of Mortgage Default Risk to disinterested 3rd parties, was a sure-fire income generator -- were in a word: Wrong!
In the real world, the real risk only "disappears" in their spreadsheets.
Subprime mortgage crisis -- wikipedia.org
[...]
With the advent of securitization, the traditional model has given way to the "originate to distribute" model, in which banks essentially sell the mortgages and distribute credit risk to investors through mortgage-backed securities and collateralized debt obligations (CDO). The sale of default risk to investors created a moral hazard in which an increased focus on processing mortgage transactions was incentivized but ensuring their credit quality was not.[109][110]
[...]
Nobel laureate Dr. A. Michael Spence wrote: "Financial innovation, intended to redistribute and reduce risk, appears mainly to have hidden it from view. An important challenge going forward is to better understand these dynamics as the analytical underpinning of an early warning system with respect to financial instability." [116]
Others argue that the instruments were understood but risk scenarios weren't properly weighted. Mortgage risks were underestimated by every institution by failing to give considerable weight to the possibility of falling housing prices. Probability distributions were based on past history, often using national averages.[117][118] Misplaced confidence in innovation and excessive optimism led to miscalculations by originators, banks, GSEs, rating agencies, regulators, and academics.
Their Risk-shuffling "derivative" math models depended on the premise that
the prices of homes would ALWAYS go up. When those prices unexpectedly went down.
NO ONE wanted the CDOs anymore. Hmmm? that's a big problem.
No one wanted (or in many cases, were simply unable) to make good on the defaulted of the Mortgage Risk -- that they now owned, when that "most unlikely" of events actually occurred. Thus massive defaults on the Obligated Debts. That Wall Street EZ-Money Orbiter came hurdling back to earth, with a Crash heard around the world in 2007 and 2008 and 2009 ...

Math matters. Lots of outcomes rest on its simple precision.
Or lack there of.
Perhaps you know all about Reinhart and Rogoff and their "lack of precision" when they convinced so many government check-writers -- that Debt is Bad, and Austerity is Good?
It's just that simple right? They have the numbers, right?
I hadn't heard of them, until recently (many thanks to posters here). So I decided to dig into their mathematical integrity -- or lack there of.
The Excel Depression
by Paul Krugman, nytimes.com -- April 18, 2013
[...]
The story so far: At the beginning of 2010, two Harvard economists, Carmen Reinhart and Kenneth Rogoff, circulated a paper, “Growth in a Time of Debt,” that purported to identify a critical “threshold,” a tipping point, for government indebtedness. Once debt exceeds 90 percent of gross domestic product, they claimed, economic growth drops off sharply.
[...]
In fact, Reinhart-Rogoff quickly achieved almost sacred status among self-proclaimed guardians of fiscal responsibility; their tipping-point claim was treated not as a disputed hypothesis but as unquestioned fact. For example, a Washington Post editorial earlier this year warned against any relaxation on the deficit front, because we are “dangerously near the 90 percent mark that economists regard as a threat to sustainable economic growth.”
[...]
In response, Ms. Reinhart and Mr. Rogoff have acknowledged the coding error, defended their other decisions and claimed that they never asserted that debt necessarily causes slow growth. That’s a bit disingenuous because they repeatedly insinuated that proposition even if they avoided saying it outright. But, in any case, what really matters isn’t what they meant to say, it’s how their work was read: Austerity enthusiasts trumpeted that supposed 90 percent tipping point as a proven fact and a reason to slash government spending even in the face of mass unemployment.
How's that old saying go?
"Denial is the first refuge of a scoundrel."
Apparently it's the first refuge of Austerity-promoting Economists too.
What 90% threshold? ... We never said High Debt causes Slow Growth.
Oh really? (It's amazing what you can find on the internet, when you take the time.)
GROWTH IN A TIME OF DEBT (pdf)
Carmen M. Reinhart, Kenneth S. Rogoff
Working Paper 15639 www.nber.org/papers/w15639
January 2010
NATIONAL BUREAU OF ECONOMIC RESEARCH
1050 Massachusetts Avenue
Cambridge, MA 02138
[pg 22]
V. Concluding Remarks
We examine the experience of forty four countries spanning up to two centuries of data on central government debt, inflation and growth. Our main finding is that across both advanced countries and emerging markets, high debt/GDP levels (90 percent and above) are associated with notably lower growth outcomes. [...]
[pg 23]
Of course, there are other vulnerabilities associated with debt buildups that depend on the composition of the debt itself. As Reinhart and Rogoff (2009b, ch. 4) emphasize and numerous models suggest, countries that choose to rely excessively on short term borrowing to fund growing debt levels are particularly vulnerable to crises in confidence that can provoke very sudden and “unexpected” financial crises. Similar statements could be made about foreign versus domestic debt, as discussed. At the very minimum, this would suggest that traditional debt management issues should be at the forefront of public policy concerns.
Reinhart and Rogoff seem to be saying "
Debt is Bad" somewhere in their concluding statements to me. Especially as they cited that "magically" 90% Debt to GDP threshold level is "associated with" low growth;
Don't cross it -- ever. Or else you'll see "negative growth" ... or so their spreadsheet math selectively asserts, as we shall soon see ...
Austerity by Excel ... Hmmmm? I know spreadsheets. They are an important tool of my trade.
I'm not alone in that regard. A lot of people know spreadsheets. They are the "pick and shovel" of the of the 21st century ... space craft go into orbit because of them. Wealth is grown and cared for with them.
And tall tales to back up Austerity Mandates can be told by them too ...
Researchers Finally Replicated Reinhart-Rogoff, and There Are Serious Problems.
by Mike Konczal, nextnewdeal.net -- Apr 16, 2013
[...]
They find that three main issues stand out. First, Reinhart and Rogoff selectively exclude years of high debt and average growth. Second, they use a debatable method to weight the countries. Third, there also appears to be a coding error that excludes high-debt and average-growth countries. All three bias in favor of their result, and without them you don't get their controversial result. Let's investigate further:
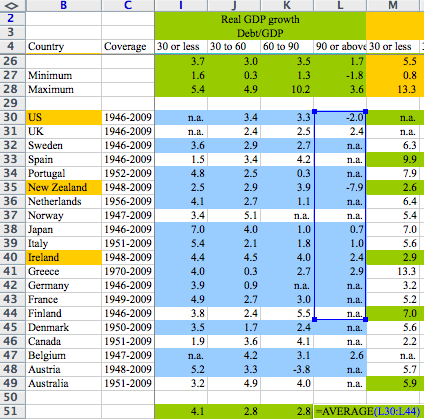
Selective Exclusions. [...] they exclude Australia (1946-1950), New Zealand (1946-1949), and Canada (1946-1950). This has consequences, as these countries have high-debt and solid growth. Canada had debt-to-GDP over 90 percent during this period and 3 percent growth. New Zealand had a debt/GDP over 90 percent from 1946-1951. If you use the average growth rate across all those years it is 2.58 percent. If you only use the last year, as Reinhart-Rogoff does, it has a growth rate of -7.6 percent. That's a big difference, especially considering how they weigh the countries.
Unconventional Weighting. [...] They then take the average real growth for each country within the buckets. So the growth rate of the 19 years that the U.K. is above 90 percent debt-to-GDP are averaged into one number. These country numbers are then averaged, equally by country, to calculate the average real GDP growth weight.
In case that didn't make sense, let's look at an example. The U.K. has 19 years (1946-1964) above 90 percent debt-to-GDP with an average 2.4 percent growth rate. New Zealand has one year in their sample above 90 percent debt-to-GDP with a growth rate of -7.6. These two numbers, 2.4 and -7.6 percent, are given equal weight in the final calculation, as they average the countries equally. Even though there are 19 times as many data points for the U.K.
[...]
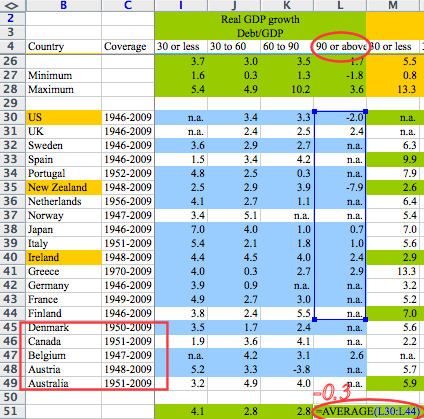
Coding Error. As Herndon-Ash-Pollin puts it: "A coding error in the RR working spreadsheet entirely excludes five countries, Australia, Austria, Belgium, Canada, and Denmark, from the analysis. [Reinhart-Rogoff] averaged cells in lines 30 to 44 instead of lines 30 to 49...This spreadsheet error...is responsible for a -0.3 percentage-point error in RR's published average real GDP growth in the highest public debt/GDP category." Belgium, in particular, has 26 years with debt-to-GDP above 90 percent, with an average growth rate of 2.6 percent (though this is only counted as one total point due to the weighting above).
Here's the that same Reinhart and Rogoff spreadsheet with it's glaring
mistaken evidence for 90% Debt Limit ratio circled:
Math matters. Lots of outcomes rest on its simple precision.
Or lack there of.
Sometimes no one stops to survey its far-reaching damage either ... Sometimes Math is more about sloganeering and austerity bandwagon joining ...
Growth in a Time of Debt
Growth in a Time of Debt, (with Kenneth S. Rogoff)
Featured in:
National Public Radio, February 16, 2011
The Economist, January 20, 2011
Forbes, January 31, 2011
MSNBC, December 2010
Wall Street Journal blog, October 1, 2010
Wall Street Journal, September 27, 2010
Financial Post, Canada, September 23, 2010
The Economist blog, September 20, 2010
Les Echos, France, September 9, 2010
Asia Times, August 10, 2010
Houston Chronicle, July 31, 2010
The Economist (blog), July 28, 2010
Washington Times, July 28, 2010
BusinessWeek, July 12, 2010
New Zealand Herald, July 1, 2010 Return to Top
Barron's June 8, 2010
Christian Science Monitor, May 26, 2010
Washington Post, May 8, 2010
FoxNews, May 7, 2010
Slate, France, May 5, 2010
Christian Science Monitor, May 4, 2010
Financial Times, May 2, 2010
FinFacts Ireland, April 30, 2010
National Public Radio, April 30, 2010
Boston Globe, April 27, 2010
Washington Post, April 27, 2010
Tulsa Beacon, April 22, 2010
Financial Times, April 14, 2010
ABC Online, April 11, 2010
The Atlantic Online, April 1, 2010
The Economist, March 31, 2010
MarketWatch, March 13, 2010
Economic Times, India, March 8, 2010
National Post, Canada, March 2, 2010
Financial Times, March 1, 2010
Financial Times, February 28, 2010
Washington Post, February 25, 2010
Christian Science Monitor, February 24, 2010
LeMonde, France, February 22, 2010
Il Sole, February 17, 2010
Dallas Morning News, February 16, 2010
Financial Times, February 16, 2010
Associated Press, February 14, 2010
BusinessWeek, February 5, 2010
National Post, February 5, 2010
New Yorker Blog, February 5, 2010
Wall Street Journal Blog, February 5, 2010
MarketWatch, February 2, 2010
Globe and Mail, Canada, February 1, 2010
New York Times Blog, February 1, 2010 Return to Top
TIME Magazine Blog, January 29, 2010
Financial Times, January 26, 2010
Telegraph, UK, January 26, 2010
Welt Online, Germany, January 23, 2010
Forbes, January 20, 2010
Financial Times Blog, January 15, 2009
Arizona Daily Sun, January 14, 2009
Globe and Mail, January 13, 2010
Ultimo Segundo, Brasil, January 13, 2010
Harian Analisa, Indonesia, January 11, 2010
Kansas City Star, January 11, 2010
Omaha World Herald, January 11, 2009
Financial Times Blog, January 10, 2010
Frankfurter Allgemeine, January 10, 2010
Le Temps, France, January 9, 2010
Moneyshow, January 8, 2010
Telegraph, UK, January 8, 2010
Expansion, Spain, January 7, 2010
Forbes, January 7, 2010
Financial Times, January 7, 2010
Le Monde, January 7, 2010
Telegraph UK, January 7, 2010
Wall Street Journal, January 7, 2010
Wall Street Pit, January 6, 2010
Wall Street Journal Blog, January 4, 2010
Will these fine establishments correct their Austerity-promoting records?
Now that the mathematical model of Reinhart and Rogoff has been debunked?
Will Paul Ryan rewrite his Path to Prosperity budget which states their study "found conclusive empirical evidence that [debt] exceeding 90 percent of the economy has a significant negative effect on economic growth"?
Does the Orbiter crash in the wilderness, when someone forgets to 'carry the two'?
Does a Home become a grievous liability, when no one carries the Obligatory Risk?
Does the Math Matter ... when plentiful examples of Debt-to-High Growth countries can be made to "disappear" by some undisclosed sleight of spreadsheet filtering?
larger
Debt is a Tool. It needs to be used wisely. Debt is a Social Contract. It needs to be paid back -- by THOSE doing the Borrowing.
But frankly without it, our destinies both individually and nationally, remain firmly affixed to slow-plodding ground.
Without investing in Debt, we have no power gird, we have no highway system, we have no upper mobility. Without investing in Debt, we have no Student Loans, we have no educated society -- we have no Future.
Without investing in the Future, we remain firmly mired in the Past.
And what an Austere Past, they want it to be ...
Dare not reach out for what the future holds America -- the oracles of Reinhart and Rogoff have selective chosen for us, a more direct Path to Poverty, ala Paul Ryan and the other fiscal hawks who fear leveraging the future growth opportunities ... that are in a word: Inevitable.
If we are to indeed grow. IF we are EACH allowed to live up to our individual potentials -- and NOT just the Debt-empowered chosen few.

