Below is a retelling of a study I did in the aftermath of the 2004 Election. It was controversial at the time but there might be more receptivity to it now. In it, I attempt to define a metric of "raw electoral power", and I examine how much of that power each candidate had in the days before Election Day, and then on Election Day itself.
Parameters
This study does not intend to judge whether certain vote methods are superior to the Electoral College - there undoubtedly are. This study instead attempts to examine the mechanics and underlying physics of our present Electoral College system, and apply them to the 2004 results.
Electoral Power
As we all know, the presidency is not decided by the popular vote. It is instead decided by the antiquated Electoral College. The Electoral College has one structural element in particular that can thwart the will of the people - each of its states (with a couple of exceptions) are winner-take-all. Ohio is worth 20 EVs whether a candidate wins 51-49, or 70-30.
What if, however, every state were to award its EVs proportionally? One could easily argue that this would be a more fair and Democratic representation of the population's will, at least as scored by the Electoral College. Everyone's vote would count in that every voter would be responsible for a fraction of an EV.
If you were to take a state and award its EVs proportionally, what you'd have is the electoral power for each candidate. If Ohio were 50/50, then each candidate would have 10 EVs. Fraudulent activity within a state would only affect the EV count within a tiny fraction.
In close elections, the theory is that since we have fifty states all going "all-or-nothing" in one way or the other (except Maine and Nebraska), they'd pretty much cancel out and reflect what the proportional result would have been anyway. This was the intent of the Electoral College, to reflect the public will (weighted by the number of EVs). But by comparing the election result to what the proportional result would have been, we can judge just how effective the Electoral College is at reflecting each candidate's electoral power.
A Note About Third Parties
The Electoral College has a built-in bias against third parties. If a candidate has consistent 15% support nationwide but never wins a state, they will get 0 EVs. In this sense, the E.C. does not come close to representing the public will. It is only in close elections that the E.C. is supposed to represent the raw electoral power for each candidate. So when making the comparison, we will look at the difference of support between the top two candidates.
2000
In 2000, the election was extremely close, by all measures. If we were to take each state's results, and award their EV's proportionally, we would find that Bush received 259.15 EV's, and that Gore received 258.4 EV's. (The rest went to third parties.) In terms of raw electoral votes, the two candidates were separated by less than one EV - very close to the real Electoral College margin.
Is it possible that fraud affected the electoral power? Each EV represents between 150,000 and 200,000 votes. That number of votes is on the outside of reasonable fraud estimates for 2000, but it is possible. But in general, the 2000 examination underscores just how close the election was, virtually too close to call.
2004
In 2004, if we were to award each state's EVs proportionally, we would find that Bush received 275.29 EVs, and that Kerry received 257.6 EVs. Again, fairly close to the real results of the election (279-252).
Is it possible that fraud affected the electoral power? Each EV in 2004 represented over 200,000 votes. In order for the electoral power to be inaccurate, it would mean that fraud of 3.6 million votes (or 1.8 million switched votes) would have happened.
The Days Before 2004 Election Day
Whether a fraud of several million votes occured is of course a tantalizing question. But one way to judge the reasonableness of this is to compare the result to the polls leading up to Election Day. I completed a study that calculated each candidates "Electoral Power" in the various state-level polls, using the data set available from electoral-vote.com, which reported all state-level polls for the last two months before election day, that reported their numbers in "registered voter" terms.
A Note On Electoral-Vote.com
Electoral-Vote.com projected Kerry would win for 2004. It is important to note, however, that each day's projection on that website only used a subset of the polls available for that day. If several polls were available for that time range, the webmaster would only pick one per state. While it's true the webmaster used a common standard to pick those polls, that ignores the matter of if there might be any hidden bias in the standard itself.
My study instead chose to count all polls, and sort them by the day the questions were being asked. It would average together polls that were asked on the same day. There are minor weighting problems with this approach, but since we are measuring "electoral power" instead of going the winner-take-all route, this is largely irrelevant.
For example, if on October 12th there were two polls asking questions in Ohio, and later reported their results as 47-43 Bush and 46-45 Kerry, then my study would say that on October 12th, Bush had 46% electoral power in Ohio, and Kerry had 44% electoral power. Bush would be awarded 9.2 EVs for that day, and Kerry would receive 8.8 for that day. Any weighting errors would only affect that count in very small fractions.
The end result was a very stable evolution or degradation of support for each candidate from day to day - no major spiking from one winner-take-all state going from one candidate to the other.
Electoral-Vote Study Results
In the days leading up to election day, all states had a large undecided component. So the electoral power that each candidate was awarded came only from those voters who were sure who they wanted to vote for. The results were illuminating:
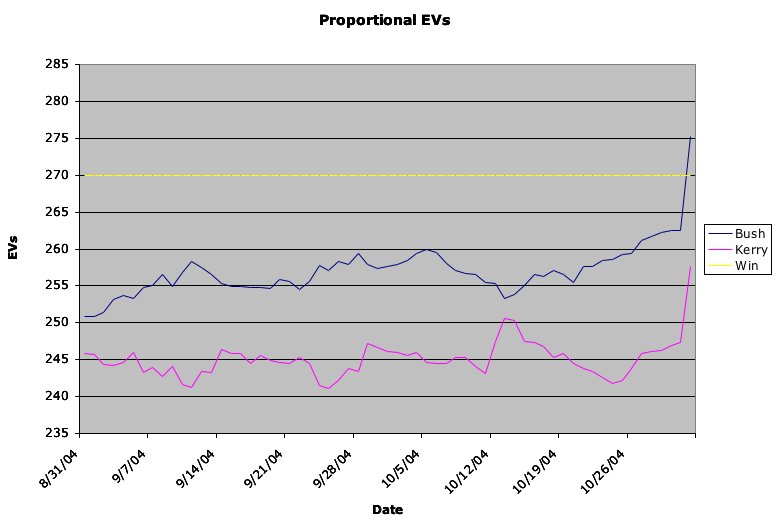
Note that this graph starts after Kerry took the hit from the Swift Boats - I believe Kerry was ahead of Bush for a little while there.
This graph measures stable electoral support for both candidates, which changes as each state is polled again. The data points reflect the days that people are being asked the poll questions. There are various different ways to interpret the data - my own interpretation is that Kerry started climbing during the debates, but then fell away afterward as people decided it wasn't quite enough.
The spike on the final day is Election Day - when the undecideds broke. It's well-known through other studies that the "undecideds break 2:1 for challengers" assumption was wrong in 2004, and this is in line with that conclusion.
Some of the feedback I've gotten is that the "proportional EV" approach is biased towards Republicans, and therefore, the level of true electoral support was closer than the graph would indicate. In fact, the opposite is true - the Electoral College was more biased to Republicans than the proportional results in 2004, as this page discusses.
What does this say about the likelihood of a multi-million-vote level of fraud? I believe it practically disproves it. This dataset was culled of polls the webmaster believed were unreasonably biased. The election day "electoral power" results are reasonably related to the level we see in the polls before election day.
Discussion
It would be easy to misinterpret the conclusions of this examination. This does not show that Bush was the "rightful winner". We go by the Electoral College, not by Proportional EVs. If there were 60,000 votes worth of fraudulent vote-switching in Ohio, then Kerry won Ohio, and Kerry's the "rightful winner". However, it is also true that if Kerry had managed to switch 60,000 votes with everything else remaining the same, it would have been an extreme, statistically unlikely departure from the raw electoral power of each candidate. And it could also be fairly argued that such a result would not reflect the popular will of the people, as affected by our EV system.
It is true, and very important to realize, that close election results tend to track with the proportional results.
Is there reason to be bitter about this? I think so. The difference in raw electoral power is something that could have and should have been realized by those that were running the Kerry campaign.
This also underscores the folly of focusing on a swing-state strategy. Look at it this way. If you're in a position when you have to capture most of the swing states, it means that you are acknowledging that your opponent has most of the safe states, and you have to make up for that. A swing state is by definition a close state. It can go either way. It's practically 50-50. When it gets that close, other variables start coming into play - the weather, last minute press releases, etc. The result starts to approach randomness. In those circumstances, your control is severely lessened, and random elements have more power. Kerry's strategy was basically that he had to get seven of the ten closest states. Flip heads seven times out of ten. It turns out, he got six. The tactic of abdicating the safe states, and trying to land the majority of the swing states, is by definition a self-defeating tactic.
The much better strategy is the fifty-state strategy - compete in the safe states even if you will lose. By working on a national narrative, it becomes the tide that lifts all... well, votes.
Conclusion
There is one big conclusion to take from this study, though. We need more Democrats. Those that believe we were robbed in 2004 may be correct, but it would only be true in letter, not in spirit. There is still a major misunderstanding between the "fraud" and "we lost" factions in this community. It would be safe to say that I am in the "we lost" faction, but this does not mean I discourage efforts towards vote reform - in fact, I strongly encourage them. My main point is that it is inaccurate and counterproductive to conclude that the Democratic Party has enough built-in support to automatically be competitive in future elections. Our built-in support in 2004 was badly inferior to Bush's, and we need to accept this only because we need to see the hilltop in order to climb it. "Vote Reform" and "Create More Democrats" are both necessary to win in future elections, but neither is sufficient on its own.
