This is another in a series of pictures showing what this year's blue wave looks like. Each congressional district has equal size in these cartograms. So far, I've done New England, the Mid-Atlantic, Ohio, and Kentucky.
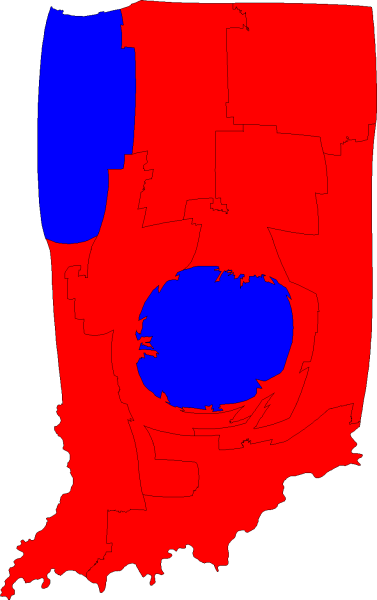
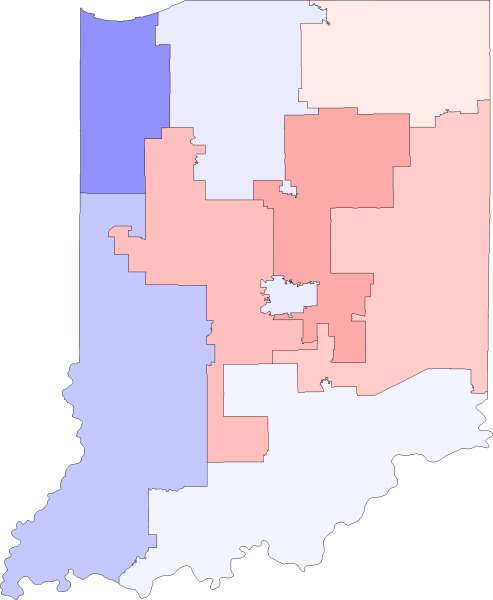
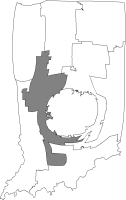
Here's how things stood before the 2006 election. (Click the thumbnails for larger images.)
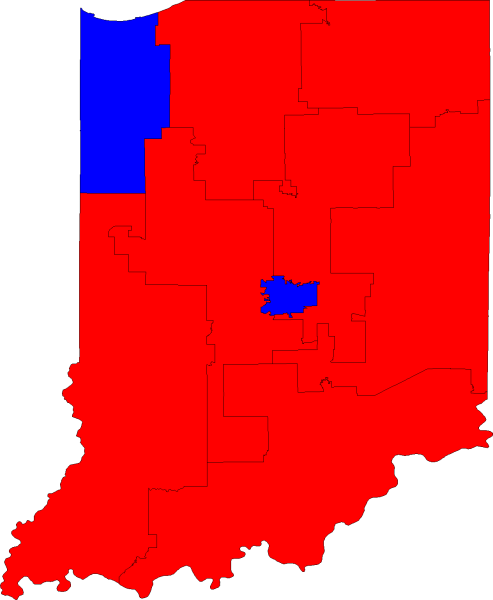
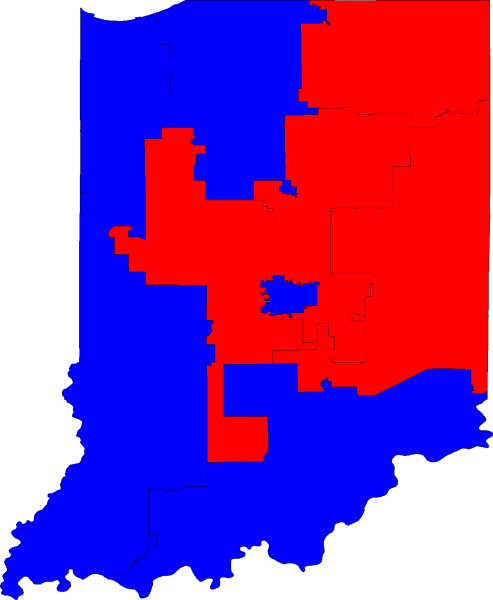
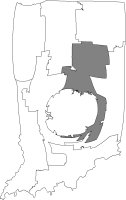
Here's how thing came out on Election Night.
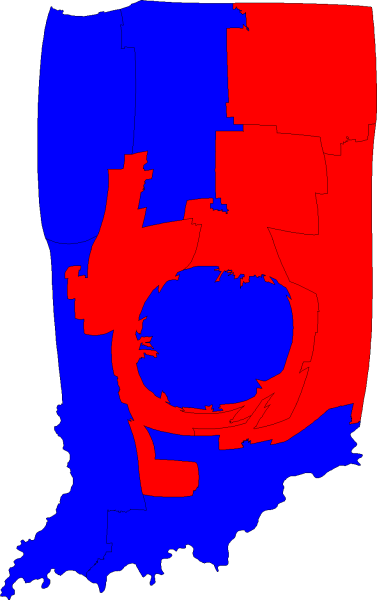
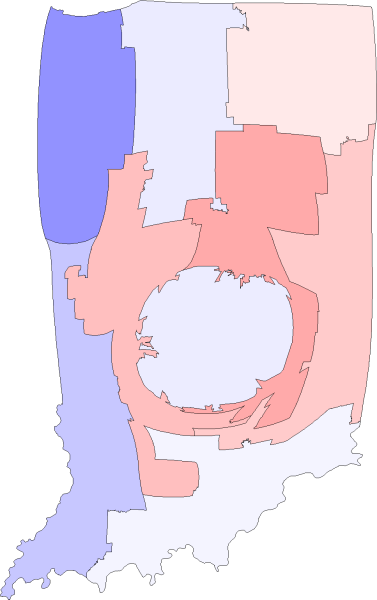
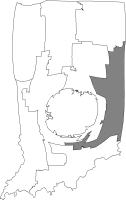
Next is a map showing the margin of victory. Carson might have been the nation's most underperforming Democrat. Even Donnelly (who I've heard described as a one-termer) had a better margin. Can Indianapolis Dems find someone better?
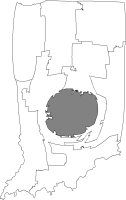
Finally, here's a map showing the margin-of-victory change from 2004 to 2006.
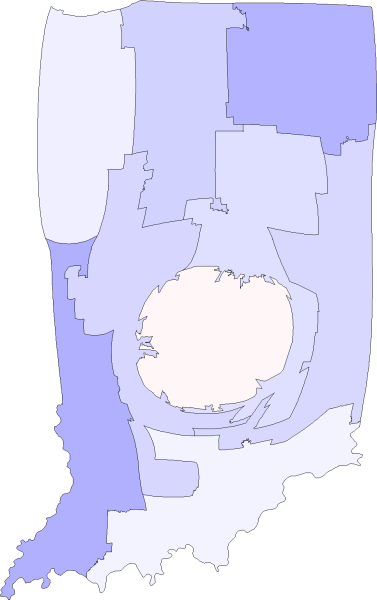
I'm most curious about IN-02. What happened in the space of two years to swing the Chocola/Donnelly matchup from 54-45 Chocola to 54-46 Donnelly?
Are we going to see Hill/Sodrel IV?
Here are thumbnails of the districts. My favorite ordinary maps of congressional districts are from the Census Bureau and the Interior Department.
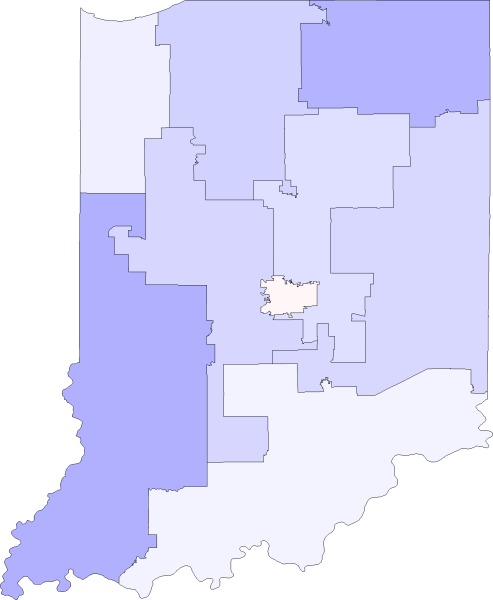
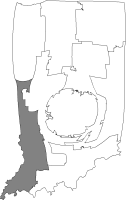
IN-01 (Chicago suburbs), Visclosky (D) defeats Leyva (R) 70-27:
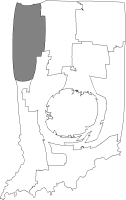
IN-02 (South Bend and Elkhart), Donnelly (D) unseats Chocola (R) 54-46:
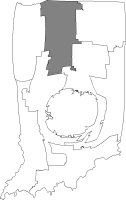
IN-03 (Fort Wayne), Souder (R) defeats Hayhurst (D) 54-46:
IN-04 (Indianapolis suburbs and Lafayette), Buyer (R) defeats Sanders (D) 62-38:
IN-05 (Indianapolis suburbs), Burton (R) defeats Carr (D) 65-31:
IN-06 (Anderson), Pence (R) defeats Walsh (D) 60-40:
IN-07 (Indianapolis), Carson (D) defeats Dickerson (R) 54-46:
IN-08 (Evansville), Ellsworth (D) unseats Hostettler (R) 61-39:
IN-09 (Louisville suburbs and Bloomington), Hill (D) unseats Sodrel (R) 50-46: