This is the second part in what will be an occasional series focusing on chemistry, by drawing examples to real-world issues where chemical concepts are easily seen.
This is also a follow-up to my first diary (carbon isotope fun), where I talked about how carbon isotopes are used in my field to identify structures, they're used to date samples via carbon-14 dating, and they provide the "smoking gun" for proving that the extra CO2 in the atmosphere is from human burning of fossil fuels.
In this post I'll address a couple issues that came up in the last diary (some answers were provided in comments, but I'm bringing them to the forefront now), and I'm including another couple of examples that I wasn't aware of or completely blanked on.
My next new topic will be radiochemistry, and I'll likely split that into two diaries over the weekend, since I've found a LOT of information.
First of all, profh brought up another use that I totally blanked on. I'm reproducing his comment, then putting in a bit more of my own take / understanding:
Another important application of isotope analysis and historically possibly the first, is (was) the working out of metabolic pathways: the intricate set of reactions that characterize all living organisms. These studies go back to the mid-1930's, initially using stable isotopes of C and N (C-13 and N-15), and shortly thereafter employing the radioactive carbon tracer, C-11. With half life of only 20 minutes, C-11 had to be produced (by cyclotron) and used on the spot and without delay. The much more convenient C-14 radioisotope was later discovered and became the C isotope of choice in most of biochemistry. Next in importance and application was P-32, especially in the nucleic acid field.
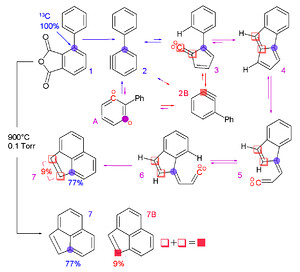
Isotope labeling studies are used extensively in biology and in chemistry in order to figure out in living systems and in natural products what carbon (or other element) comes from what starting material. My understanding is that this can be done either utilizing radioactive isotopes (eg, C-14 or C-11) or the stable isotope C-13, depending on what information is desired. Metabolic pathways, natural product biosynthetic pathways, "what atom goes where" in chemical reactions, and other relevant information can be garnered in this manner. In the example below, the blue-dotted carbon was "traced" from starting material to product.
Carbon-14 also provides evidence that the extra CO2 is from human activity, but the story is a bit more complicated, because of the atomic bomb testing activity in the mid-1900s. Thus, the C-14 level in the atmosphere has looked like this since the 1950's (sorry that the axis has been chopped - the spike started around 1960 or so)
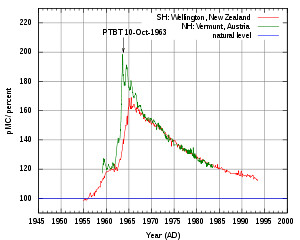
Thus, it's more annoying to separate out the two man-made effects, so it's used less rarely to show the human influence of burning fossil fuels. Carbon-14 is restocked naturally in the atmosphere due to cosmic radiation, so without human influence there's a pretty constant level of C-14. Fossil fuels, being really old, have much reduced levels of C-14.
Fishoutofwater asked about a Dr. Roy Spencer blog post claiming to throw cold water on the claim that the C-13 signature meant nothing. Another poster (lookingup), found the takedown for me, and it's here. I'm summarizing below, the full information can be found in the link provided.
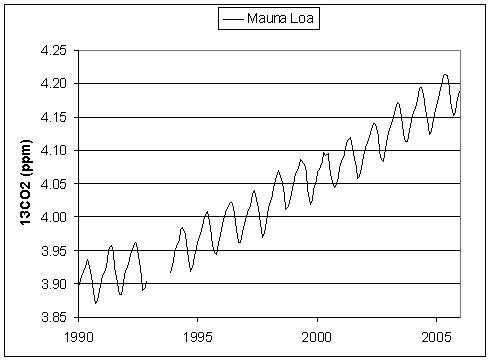
Spencer starts off OK, and indeed (with minor math mistakes), is OK up until and including these two graphs:
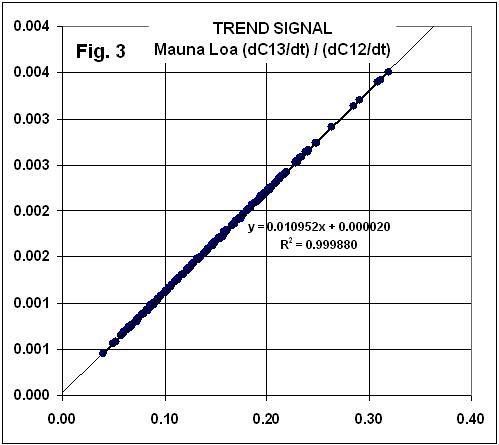
But, then, he goes way off the rail in detrending the data and matching them back together, giving the following suspiciously similar graph:
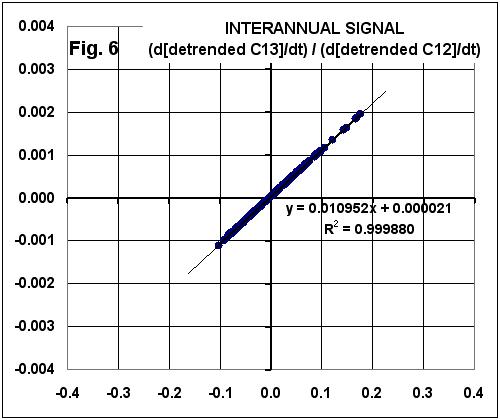
Significantly, note that the ratio of C13 variability to CO2 variability is EXACTLY THE SAME as that seen in the trends!
BOTTOM LINE: If the C13/C12 relationship during NATURAL inter-annual variability is the same as that found for the trends, how can people claim that the trend signal is MANMADE??
The argument is a logical fallacy. But it’s nowhere near as embarrassing as the mathematical fallacy.
snipping out math - lots and lots of math - see link
We see that the new time series of time derivatives are equal to the old time series of time derivatives, offset by constants. Spencer’s figure 6 is a scatter plot of against .
If we take any two time series and regress one against the other, we’ll get a slope. If we take the same two time series offset by constants and regress one against the other, we’ll get exactly the same slope. Necessarily. For Sure. Every time.
So Spencer’s “Significantly, … EXACTLY THE SAME as that seen in the trends!” is nothing more than an obvious consequence of the way he analyzed the data. It’s not “significant” and it means absolutely nothing except that Spencer really doesn’t understand what he’s doing.
In other words, he did a mathematical circular argument, and two possibilities exist:
- He knows he did a circular argument and hopes that the reader is deceived (indeed, it takes a working knowledge of calculus to spot the mathematical error), or
- He doesn't know or understand calculus enough to spot his own error.
As an aside, this is the sort of error that should never slip through peer review, but a blog posting isn't subject to that sort of peer review. (This seems a good time to note that I am not infallible, and if you spot errors, let me know).
Unfortunately, I was unable to find information regarding hopefulskeptic's question regarding whether anyone has studied deep-ocean isotopic distribution vs shallow-ocean isotopic distribution. However, this does bring up another point that shows that Dr. Roy Spencer's contention that the extra CO2 is from the oceans and volcanoes is wrong: since the pH of the oceans worldwide is going down, it means that the oceans are net absorbing CO2, so they are mitigating the impact on atmospheric CO2, instead of exacerbating it. The litany of effects that this particular acidification has is outside of the scope of this diary, so I'll skip that for now.
The closest I was able to find regarding ocean C-13 distribution is here. Helpfully, it has an explanation of what the "standard term" is for describing the deficit in C-13 is, so that can help in reading other graphs. It did note that C-13 levels in deep-sea sedimentary analysis has helped reveal what happened to deep ocean currents during glaciation events, etc.
