The EPA and scientists have known for many years that smog is worse on hot days. Reactions involving hydrocarbons, sunlight, water vapor and oxidants are sped up rapidly as temperatures rise. A new study published in the Proceedings of the National Academy of Sciences using earth systems models that incorporate chemical reaction models shows that hot climates in the geologic record generated large amounts of natural smog from volatiles in trees and plants. This smog contained large amounts of greenhouse gases other than CO2. These other greenhouse gases including methane, oxides of nitrogen and ozone amplified the greenhouse effect in a positive feedback loop.
Under present day conditions ozone levels rise to high levels on hot sunny summer days in urban areas that have large amounts of hydrocarbon emissions from industry and vehicles. Domes of hot smoggy CO2 enriched air can hover over cities raising respiratory death rates during heat waves. However, as CO2 levels rise, heat waves will be hotter, smoggier, and deadlier to sensitive individuals, for the same amount of hydrocarbon sources.
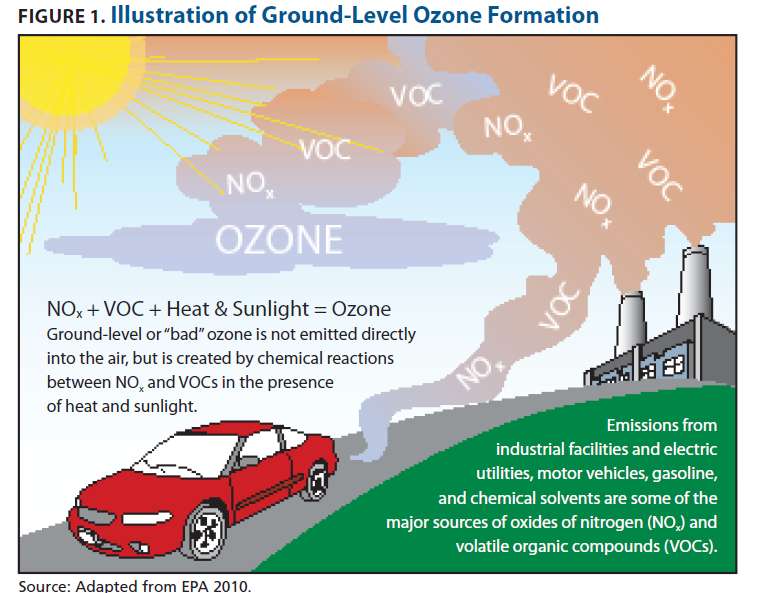
“Bad” ozone can be distinguished from “good” ozone, which is present at high altitudes in the atmosphere and beneficial because it protects the earth from excessive ultraviolet radiation. But bad, or ground-level, ozone—a primary component of smog—is harmful to health. Human activities such as driving cars and generating electricity are major sources of the ingredients that form smog.
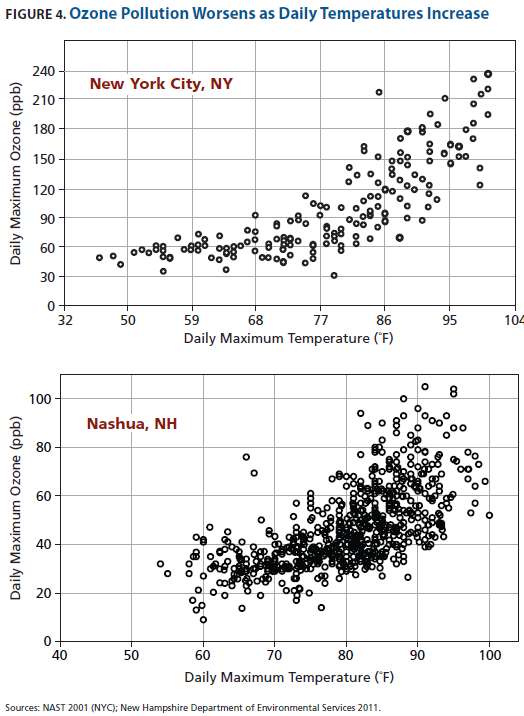
These two graphs show a strong positive correlation between temperature (horizontal axis) and ozone levels (vertical axis) in New York City and Nashua, NH.
Based on observed data from New York City for May to October (“smog season,” averaging period not specified) for the years 1988 to 1990, and observed data (using a one-hour average) from Nashua, NH, for the years 2005 to 2010, both scatter plots show that the higher the temperature, the higher the ozone level, regardless of a city’s size.
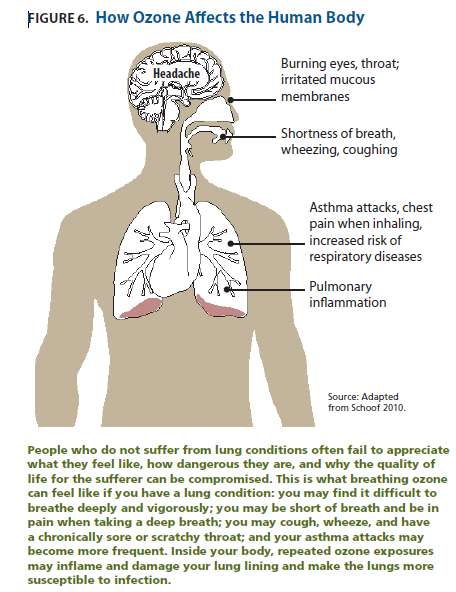
Ozone is a powerful oxidant which injures the lungs
A new earth systems modeling study shows that hot paleoclimates may have produced high levels of natural smog by photo-oxidation of organic volatiles derived from pine trees and other vegetation.
Under today's conditions the great Smoky mountains in the southeast U.S. are naturally smoggy on hot summer days. Isoprene derived from pine trees are oxidized into smog. Likewise the Blue Mountains in Australia produce a hydrocarbon haze derived from eucalyptus trees. In the hot climates of the past the natural smog was much more intense according to model results. Levels of methane, oxides of nitrogen and ozone were naturally high, in part, because high levels of isoprene evaporated from trees in forested regions.
Ancient hot climates were naturally smoggy
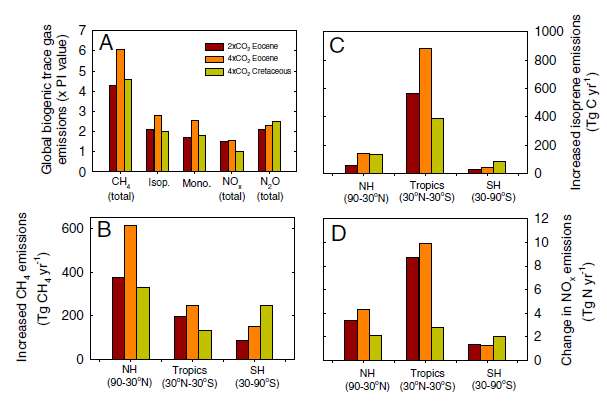 Terrestrial ecosystem emissions of reactive trace gases in the Eocene and Cretaceous. Simulated equilibrium global-scale (A) reactive biogenic trace gas emissions to the atmosphere for the 2 × CO2 (560 ppm) and 4 × CO2 (1,120 ppm) Eocene, and 4 × CO2 Cretaceous climates, relative to the preindustrial (PI) era. Panels B, C, and D, respectively, show zonal total fluxes for methane (CH4) from all biogenic sources (wetlands, biomass burning, oceans, and termites), isoprene released from forested regions, and oxides of nitrogen (NOx ¼ NO þ NO2) released from soils, and generated by biomass burning and lightning
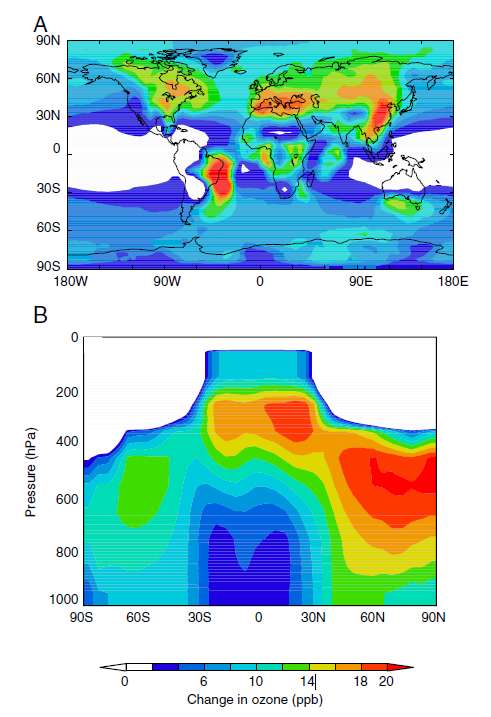
Elevated surface ozone concentrations in the Eocene compared to
the preindustrial world. Simulated increases in (A) mean annual surface level
ozone for the 4 × CO2 Eocene simulation and (B) the cross-sectional zonal
average profile through the atmosphere. Ozone increases in (A) and (B)
are relative to the preindustrial control simulation. Note in (A) changes in
ozone fields are plotted over the present-day continental geography
Overall, ecosystem-driven changes in chemistry induced climate feedbacks that increased global mean annual land surface temperatures by 1.4 and 2.7 K for the 2× and 4 × CO2 Eocene simulations, respectively, and 2.2 K for the Cretaceous (Fig. 3 E and F). The relative contribution of each trace GHG to increased Eocene and Cretaceous land temperatures at 4 × CO2, assessed with multiple separate coupled-ocean atmosphere HadCM3L model simulations, revealed methane and associated increases in stratospheric water vapor dominate, with nitrous oxide and tropospheric ozone contributing approximately equally to the remainder
CO2 emissions rates have now returned to near worst case IPCC projected levels after a dip for the recession. As CO2 emissions rise, the earth's history shows that the heating caused by CO2 will be amplified by increasing levels of toxic smog enriched in gases that are even stronger greenhouse gases than CO2.
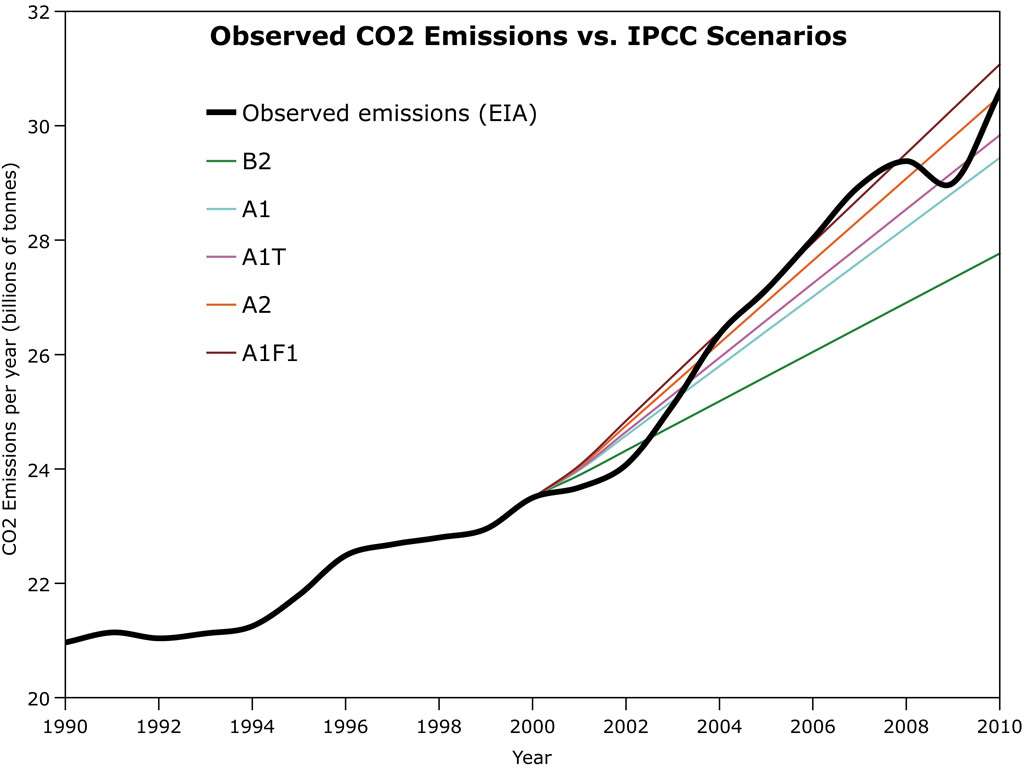
These simulations for past greenhouse worlds contextualize projections of future emission scenarios by the Intergovernmental Panel on Climate Change. Projected future anthropogenictrace gas emissions suggest humanity is likely to recreate atmospheric conditions in the Anthropocene not seen on Earth for the past 20–50 Ma, and that could increase Earth’s longer-term climate sensitivity to rising atmospheric CO2 concentrations.
