This Diary will use graphics and data to make an important point. It is a part of my smartmeter series.
Brief Intro
I had been hit with unreasonable energy use claims from my smartmeter. I knew they were unreasonable because I am a science minded former electronics technician who had spent the previous year becomming familiar with my electrical appliances and how my use of them showed up in my smartmeter's data. I didn't know everything about my one bedroom apartment's appliances but I had the advantage of being frugal and also not owning very much.
The nature and the magnitude of my high energy use meant that it could only be attributed to one device: my central heater. Its the only device that runs throughout the day and also uses large amounts of energy.
What I needed to know was: How often does my heater actually run?
God Blessed Me
The thought had occurred to me around 9:45am on Feb 09th. I was drinking coffee and I knew it was going to be cold that day. The heater had already run two cycles before I thought of tracking it. I made notations of when it turned on and off.
It was cloudy and 20 degrees outside. There was a strong north wind. I didnt know at the time just how similar that day would be to the days in question.
After I finished the log, I went back and found the heater ran 27% of the time.
This was important because the energy use levels my meter had claimed would require my heater to run between 60% and 72% of the time. The data requires it to run 100% of the time for a while on Feb 02.
After a few days I was able to get the smartmeter data and see if it matched my heater log. It did.
Relation Noted - Just The Facts
What I saw in the data was a relation between the minutes that my heater was on and the readings from the smartmeter. My heater turned on at 10:22am and turned off again at 10:37am. This means the heater was on for 8 minutes of the "10:15am to 10:30am" segment and 7 minutes of the "10:30 to 10:45am" segment. The meter readings were .889 for the "10:15am to 10:30am" segment and .775 for the "10:30 to 10:45am" segment.
Notice that? 8 minutes - .889; 7 minutes - .775
In my apartment this works because my heater is about 6,000watts. This produces about a '1.5' reading if the heater runs an entire 15 minute segment. (15 minutes - 1.5)
So I created a graphic to hopefully illustrate this. Note the orange bars that show how many minutes per each segment that the heater was on and the blue bars which show the usage readings. The scales are 0 - 15 minutes and 0 - 1.5kWh respectively.
There are times when there is energy use but no heater use and this is becasue I do have a hot water heater and it does run. It just doesn't run very often (5 to 6 minutes every 4 to 6 hours). I also obviously have other things...like a space heater and a TV and my refridgerator. All of these things were running on this day.
But the heater dwarfs them all.
Notice how the 400Watt space heater (constant 400W) makes a steady addition to the numbers from 4pm to just before 10pm (they increase by '.1').
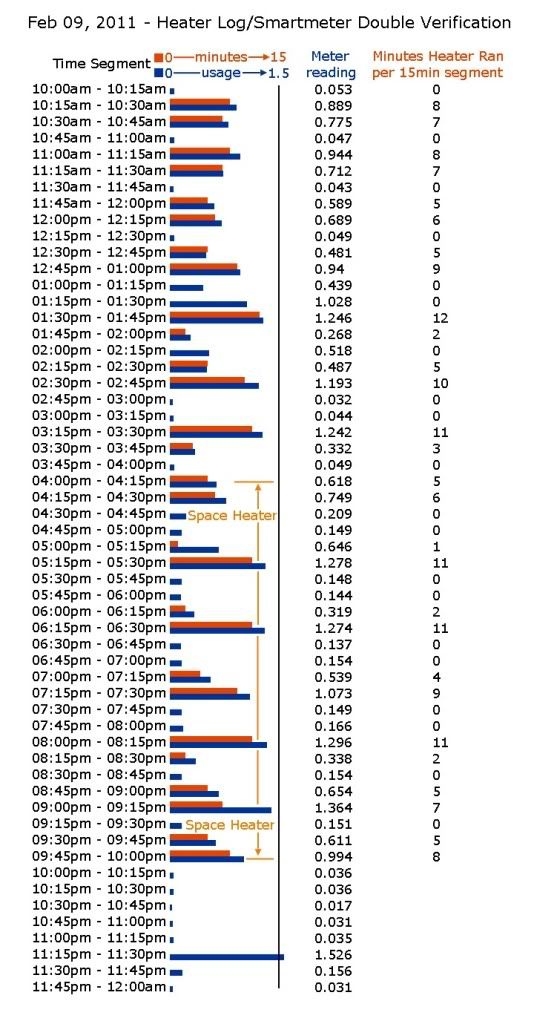
At just before 10pm, I turned the thermostat down to 61 and turned everything off and went to bed. You see the next energy use spike from "11:15pm to 11:30pm".
My guess is that the heater ran from 11:15pm to 11:31pm.
The heater log is not perfect. I only noted time by a digital clock and never noted the seconds. There is also the mismatch between 'my 15 minutes' and 'the smartmeter's 15 minutes'. These things can throw off the data relationship.
Iv'e looked at many many days worth of data and I always see a reasonable pattern.
My heater always stays off long enough to produce a low 'background noise' reading (normal apartment stuff). The above chart shows how on this 20 degree cloudy day with a strong northwest wind, my heater managed to maintain my apartment at 64 degrees while still only running 27% of the time.
Now look at these numbers my meter produced on Feb 01st:
12:00 pm 12:15 pm 0.71 A
12:15 pm 12:30 pm 0.61 A
12:30 pm 12:45 pm 1.123 A
12:45 pm 01:00 pm 1.104 A
01:00 pm 01:15 pm 0.81 A
01:15 pm 01:30 pm 0.55 A
01:30 pm 01:45 pm 2.49 A -- this is just shy of 10,000 watts for an entire 15 minutes.
01:45 pm 02:00 pm 1.272 A
02:00 pm 02:15 pm 0.607 A
02:15 pm 02:30 pm 1.494 A
02:30 pm 02:45 pm 1.262 A
02:45 pm 03:00 pm 0.605 A
03:00 pm 03:15 pm 0.916 A
03:15 pm 03:30 pm 1.367 A
03:30 pm 03:45 pm 0.635 A
03:45 pm 04:00 pm 1.08 A
04:00 pm 04:15 pm 1.195 A
04:15 pm 04:30 pm 0.556 A
04:30 pm 04:45 pm 1.423 A
04:45 pm 05:00 pm 0.893 A
05:00 pm 05:15 pm 1.356 A
05:15 pm 05:30 pm 1.266 A
05:30 pm 05:45 pm 0.97 A
05:45 pm 06:00 pm 0.599 A
06:00 pm 06:15 pm 0.973 A
06:15 pm 06:30 pm 1.21 A
06:30 pm 06:45 pm 1.09 A
06:45 pm 07:00 pm 0.702 A
07:00 pm 07:15 pm 1.121 A
07:15 pm 07:30 pm 1.327 A
07:30 pm 07:45 pm 0.743 A
07:45 pm 08:00 pm 0.93 A
08:00 pm 08:15 pm 1.326 A
08:15 pm 08:30 pm 1.112 A
08:30 pm 08:45 pm 0.81 A
08:45 pm 09:00 pm 1.612 A
09:00 pm 09:15 pm 1.265 A
09:15 pm 09:30 pm 0.788 A
09:30 pm 09:45 pm 0.948 A
09:45 pm 10:00 pm 1.454 A
10:00 pm 10:15 pm 0.924 A
10:15 pm 10:30 pm 0.778 A
10:30 pm 10:45 pm 1.435 A
10:45 pm 11:00 pm 1.09 A
11:00 pm 11:15 pm 0.784 A
11:15 pm 11:30 pm 1.369 A
11:30 pm 11:45 pm 0.029 A
11:45 pm 12:00 am 0.965 A
These numbers require my heater to never be off for very long. They require my heater to run a haphazard constantly varying duty cycle.
These numbers start climbing at the exact same time that the FERC study says that power generators started having problems.
pdf page 66
The storm hit on February 1. Beginning at approximately 12:00 PM on that day, power plants across Texas experienced problems due to the cold weather. These included freezing instrumentation, freezing pipes, freezing drain lines, natural gas curtailments, and natural gas pressure reductions due to high usage. Between noon and midnight on February 1, two large coal units and 18 natural gas units tripped or failed to start for varying periods of time. Another six natural gas units and 13 wind plants were derated during this period. As of midnight on February 1, unavailable generation capacity in ERCOT (not counting scheduled outages) reached 6022 MW.
I hope this diary helps you to understand why I am convinced my meter made a serious mistake. The data it produced for the period is simply not reasonable for my apartment.
Go back and look at the graphs in this diary. Look how different the beginning days of February are.
I still don't know if this was accidental or what but it doesnt give me confidence that the FERC has just minimized the weather on Feb 09 and 10 even though those days were just as cold.
Reference - Heater Log Text File
--------------------------------- feb 09 2011 -------------
feb 09 2011 -- heater log - thermostat at 64. no space heater until 4pm.
10am temp 18 degrees. NOAA - 16 at 1047am
by noon it ws 21 degrees.
it was cloudy and cold.
heater ran 27 % of the time on this day with therm set at 64.
I had therm at 61 on feb 02 2011.
Note that I missed the first two heater cycles becasue I hadnt yet thought of keeping a log.
Note the hot water heater usage contributing to the 4am and 4:15am readings.
Note how low base usage is. Its the refridgerator and standby power supplies.
Note how the heater turned on at 1022am (8 minutes of the 1015-1030 segment)
and the usage was .889.
Note how the heater continued on for 7 minutes of the next cycle
and the usage was .775
it seems that the usage follows the minutes the heater is on numerically and
this makes sense if the heater is 6,000 watts which would be a 1.5 reading
for a 15 minute period. What I noticed is that the higher the usage value,
the longer the heater would have had to have been running to achieve that usage.
This decreases the time available for the heater to be off and that contradicts
the heater log (which matches the data for Feb 09 and Feb 10) which suggests
that even on the coldest of days, the heater will stay off at least 30 minutes.
12:00 am 12:15 am 0.031 A
12:15 am 12:30 am 0.016 A
12:30 am 12:45 am 0.035 A
12:45 am 01:00 am 0.031 A
01:00 am 01:15 am 0.016 A
01:15 am 01:30 am 0.034 A
01:30 am 01:45 am 0.031 A
01:45 am 02:00 am 0.016 A
02:00 am 02:15 am 0.035 A
02:15 am 02:30 am 0.03 A
02:30 am 02:45 am 0.016 A
02:45 am 03:00 am 0.034 A
03:00 am 03:15 am 0.037 A
03:15 am 03:30 am 0.061 A
03:30 am 03:45 am 0.042 A
03:45 am 04:00 am 0.053 A
04:00 am 04:15 am 0.169 A - -hot water heater
04:15 am 04:30 am 0.304 A - hot water heater
04:30 am 04:45 am 0.014 A
04:45 am 05:00 am 0.04 A
05:00 am 05:15 am 0.024 A
05:15 am 05:30 am 0.023 A
05:30 am 05:45 am 0.037 A
05:45 am 06:00 am 0.017 A
06:00 am 06:15 am 0.026 A
06:15 am 06:30 am 0.036 A
06:30 am 06:45 am 0.014 A
06:45 am 07:00 am 0.029 A
07:00 am 07:15 am 0.034 A
07:15 am 07:30 am 0.014 A
07:30 am 07:45 am 0.032 A
07:45 am 08:00 am 0.038 A
08:00 am 08:15 am 0.018 A
08:15 am 08:30 am 0.031 A
08:30 am 08:45 am 0.373 A
08:45 am 09:00 am 1.711 A -- I missed first two cycles but its clear that heater was on here.
09:00 am 09:15 am 0.797 A -- heater was on for part of this segment
09:15 am 09:30 am 0.071 A -- heater was off here. my guess - off 22 min
09:30 am 09:45 am 1.7 A -- heater was on again
09:45 am 10:00 am 0.421 A 18 degrees according to wfaa
10:00 am 10:15 am 0.053 A -- heater was off again. my guess - off 26 min
10:15 am 10:30 am 0.889 A 10:22 am on -- 8 minutes -- usage is .889. 15MIN ON
10:30 am 10:45 am 0.775 A 10:37 am off -- 7 minutes -- usage is .775.
10:45 am 11:00 am 0.047 A 30 MIN oFF
11:00 am 11:15 am 0.944 A 11:07am on 15 MIN ON
11:15 am 11:30 am 0.712 A 11:22am off
11:30 am 11:45 am 0.043 A 33 MIN OFF
11:45 am 12:00 pm 0.589 A 11:55am on 11MIN ON
12:00 pm 12:15 pm 0.689 A 12:06pmoff 21 degrees according to wfaa - its cloudy
12:15 pm 12:30 pm 0.049 A 34 MIN OFF
12:30 pm 12:45 pm 0.481 A 12:40pm on 14 MIN ON
12:45 pm 01:00 pm 0.94 A 12:54pm off
01:00 pm 01:15 pm 0.439 A 39 MIN OFF
01:15 pm 01:30 pm 1.028 A
01:30 pm 01:45 pm 1.246 A 1:33pm on 14 MIN ON
01:45 pm 02:00 pm 0.268 A 1:47pm off
02:00 pm 02:15 pm 0.518 A 38 MIN OFF
02:15 pm 02:30 pm 0.487 A 2:25pm on 15 MIN oN
02:30 pm 02:45 pm 1.193 A 2:40pm off
02:45 pm 03:00 pm 0.032 A 39 MIN oFF
03:00 pm 03:15 pm 0.044 A
03:15 pm 03:30 pm 1.242 A 3:19pm on 14 MIN ON
03:30 pm 03:45 pm 0.332 A 3:33pm off
03:45 pm 04:00 pm 0.049 A 37 MIN oFF
04:00 pm 04:15 pm 0.618 A 4:10pm on -- space heater on at 400 watt setting. 11 MIN ON
04:15 pm 04:30 pm 0.749 A 4:21 pm off
04:30 pm 04:45 pm 0.209 A
04:45 pm 05:00 pm 0.149 A 53 MIN OFF
05:00 pm 05:15 pm 0.646 A 5:14pm on 12 MIN oN
05:15 pm 05:30 pm 1.278 A 5:26pm off
05:30 pm 05:45 pm 0.148 A
05:45 pm 06:00 pm 0.144 A 47 MIN OFF
06:00 pm 06:15 pm 0.319 A 6:13pm on 13 MIN ON
06:15 pm 06:30 pm 1.274 A 6:26pm off
06:30 pm 06:45 pm 0.137 A
06:45 pm 07:00 pm 0.154 A 45 MIN oFF
07:00 pm 07:15 pm 0.539 A 7:11pm on 13 MIN oN
07:15 pm 07:30 pm 1.073 A 7:24pm off
07:30 pm 07:45 pm 0.149 A
07:45 pm 08:00 pm 0.166 A 40 MIN OFF
08:00 pm 08:15 pm 1.296 A 8:04pm on 13 MIN oN
08:15 pm 08:30 pm 0.338 A 8:17pm off
08:30 pm 08:45 pm 0.154 A 38 MIN oFF
08:45 pm 09:00 pm 0.654 A 8:55pm on 12 MIN oN
09:00 pm 09:15 pm 1.364 A 9:07pm off 33 MIN OFF
09:15 pm 09:30 pm 0.151 A
09:30 pm 09:45 pm 0.611 A 9:40pm on 13 MIN oN
09:45 pm 10:00 pm 0.994 A 9:53pm off - space heater off - therm to 61 - going to bed.
10:00 pm 10:15 pm 0.036 A
10:15 pm 10:30 pm 0.036 A
10:30 pm 10:45 pm 0.017 A
10:45 pm 11:00 pm 0.031 A
11:00 pm 11:15 pm 0.035 A
11:15 pm 11:30 pm 1.526 A --- not on again till here according to data (I wasnt keeping track)
11:30 pm 11:45 pm 0.156 A --- my guess would be 11:15on and 1131 off
11:45 pm 12:00 am 0.031 A
--------------------------------- feb 10 2011 -------------
Note: The heater was turning on and off as normal as can be seen in the graphic and also
this data. I didnt track until 7:40am becasue i was asleep.
Note that when I got up, I turned the thermostat up to 64 from 61. This caused the
heater to run to shorter cycles resulting in an off period of 20 minutes. It then went
back to a more normal schedule. If you look at the data for Feb 09 you can see the
two cycles that occurred before I started my log and they also appear closer together.
This again makes sense becasue I turned the thermostat up to 64 from 61 when I got
up.
feb 10 2011
12:00 am 12:15 am 0.976 A
12:15 am 12:30 am 0.588 A
12:30 am 12:45 am 0.03 A
12:45 am 01:00 am 0.818 A
01:00 am 01:15 am 0.74 A
01:15 am 01:30 am 0.031 A
01:30 am 01:45 am 0.79 A
01:45 am 02:00 am 1.218 A
02:00 am 02:15 am 0.03 A
02:15 am 02:30 am 1.094 A
02:30 am 02:45 am 0.696 A
02:45 am 03:00 am 0.056 A
03:00 am 03:15 am 1.062 A
03:15 am 03:30 am 0.511 A
03:30 am 03:45 am 0.022 A
03:45 am 04:00 am 1.403 A
04:00 am 04:15 am 0.112 A
04:15 am 04:30 am 0.49 A
04:30 am 04:45 am 1.158 A
04:45 am 05:00 am 0.014 A
05:00 am 05:15 am 0.972 A
05:15 am 05:30 am 0.629 A
05:30 am 05:45 am 0.062 A
05:45 am 06:00 am 1.505 A
06:00 am 06:15 am 0.031 A
06:15 am 06:30 am 0.83 A
06:30 am 06:45 am 1.228 A
06:45 am 07:00 am 0.031 A
07:00 am 07:15 am 1.55 A
07:15 am 07:30 am 0.04 A
07:30 am 07:45 am 0.781 A 7:40am - on 20 MIN ON
07:45 am 08:00 am 1.751 A 8am off
08:00 am 08:15 am 0.24 A 21 MIN OFF
08:15 am 08:30 am 1.339 A 8:21 on
08:30 am 08:45 am 0.1 A 8:31 off 10 MIN ON
08:45 am 09:00 am 0.865 A 8:52 am on 21 MIN OFF
09:00 am 09:15 am 0.421 A 9:04off 12 MIN ON
09:15 am 09:30 am 0.025 A
09:30 am 09:45 am 0.944 A 939 on 35 MIN OFF
09:45 am 10:00 am 1.489 A 949 off 10 MIN ON
10:00 am 10:15 am 0.049 A OFF for the rest of the day
10:15 am 10:30 am 0.044 A
10:30 am 10:45 am 0.533 A
10:45 am 11:00 am 0.052 A
11:00 am 11:15 am 0.044 A
11:15 am 11:30 am 0.06 A
11:30 am 11:45 am 0.049 A
11:45 am 12:00 pm 0.037 A
12:00 pm 12:15 pm 0.07 A
12:15 pm 12:30 pm 0.062 A
12:30 pm 12:45 pm 0.037 A
12:45 pm 01:00 pm 0.055 A
01:00 pm 01:15 pm 0.053 A
01:15 pm 01:30 pm 0.032 A
01:30 pm 01:45 pm 0.235 A
01:45 pm 02:00 pm 0.311 A
02:00 pm 02:15 pm 0.034 A
02:15 pm 02:30 pm 0.05 A
02:30 pm 02:45 pm 0.054 A
02:45 pm 03:00 pm 0.034 A
03:00 pm 03:15 pm 0.052 A
03:15 pm 03:30 pm 0.056 A
03:30 pm 03:45 pm 0.038 A
03:45 pm 04:00 pm 0.065 A
04:00 pm 04:15 pm 0.068 A
04:15 pm 04:30 pm 0.049 A
04:30 pm 04:45 pm 0.062 A
04:45 pm 05:00 pm 0.068 A
05:00 pm 05:15 pm 0.049 A
05:15 pm 05:30 pm 0.197 A
05:30 pm 05:45 pm 0.203 A
05:45 pm 06:00 pm 0.143 A
06:00 pm 06:15 pm 0.125 A
06:15 pm 06:30 pm 0.497 A
06:30 pm 06:45 pm 0.047 A
06:45 pm 07:00 pm 0.064 A
07:00 pm 07:15 pm 0.084 A
07:15 pm 07:30 pm 0.152 A
07:30 pm 07:45 pm 0.13 A
07:45 pm 08:00 pm 0.05 A
08:00 pm 08:15 pm 0.052 A
08:15 pm 08:30 pm 0.074 A
08:30 pm 08:45 pm 0.065 A
08:45 pm 09:00 pm 0.066 A
09:00 pm 09:15 pm 0.078 A
09:15 pm 09:30 pm 0.065 A
09:30 pm 09:45 pm 0.048 A
09:45 pm 10:00 pm 0.056 A
10:00 pm 10:15 pm 0.028 A
10:15 pm 10:30 pm 0.023 A
10:30 pm 10:45 pm 0.04 A
10:45 pm 11:00 pm 0.029 A
11:00 pm 11:15 pm 0.026 A
11:15 pm 11:30 pm 0.04 A
11:30 pm 11:45 pm 0.028 A
11:45 pm 12:00 am 0.457 A
