Inspired by the late Johnny Rook's Climaticide Chronicles, this is an occasional series on the state of Arctic sea ice.
Headlines
- July 2011 mean sea ice extent was lowest in the satellite record (since 1979),
- Sea ice extent is the second-lowest in the history of the satellite record (since 1979) as of this date.
- Temperatures in the Arctic Basin have continued to be above normal in August to date
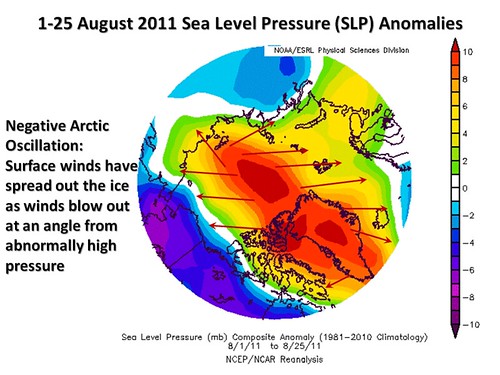
- The Arctic Oscillation has been negative (no Arctic dipole in August), which resulted in spreading out of the winds from the North Pole, and spreading out of loose pack ice
- A record sea ice minimum this year (below 2007) is not likely.
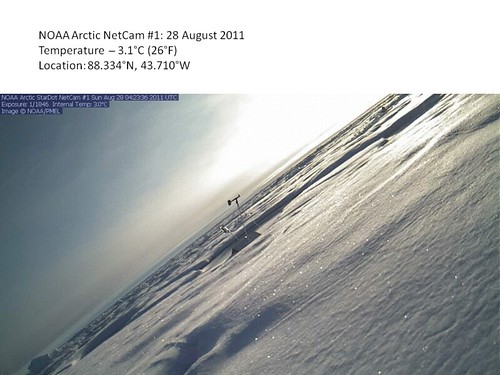
Details below the North Pole Web Cam from today, and the orange curlicue.
NOAA North Pole Arctic Sea Ice WebCam picture for 20 UTC 28 August 2011
Arctic Sea Ice Forecasts from Professional (and not-necessarily professional) Sources
There's an organization that has accepted forecasts each year since 2008 on how low the minimum Arctic sea ice extent will be each year, called the Arctic Research Consortium of the United States (ARCUS). These forecasts appear on their Study on Environmental Arctic Change (SEARCH) website. Predictions are tough to make and depend on highly difficult-to-predict short-term climate variations in cloudiness, large-scale atmospheric flow, surface winds, and air and sea surface temperature departures from normal. All of items in this list impact on and indeed feed back on each other, making any prediction of their values that much more difficult.
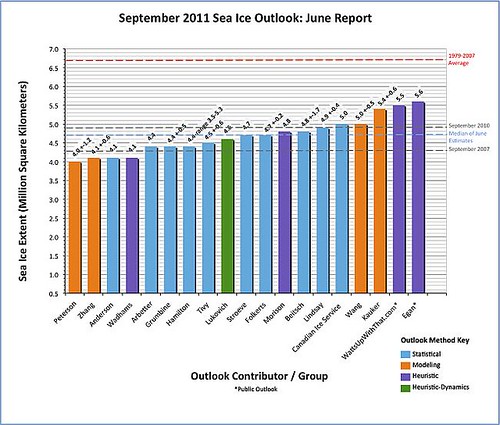
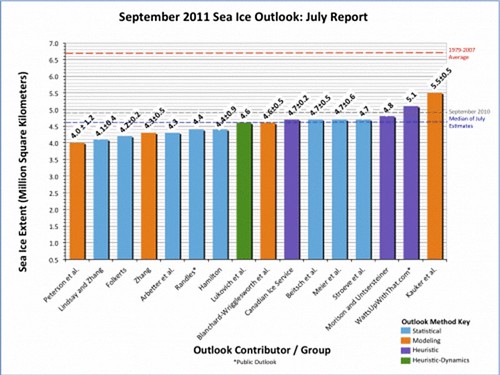
Hence the forecasts don't start to be made until June and we have June through August 2011 forecasts in the books now. The graphics of June, July and August forecasts, in that order, are below:
June 2011 Forecasts of September 2011 Minimum Arctic Sea Ice Extent
July 2011 Forecasts of September 2011 Minimum Arctic Sea Ice Extent
August 2011 Forecasts of September 2011 Minimum Arctic Sea Ice Extent
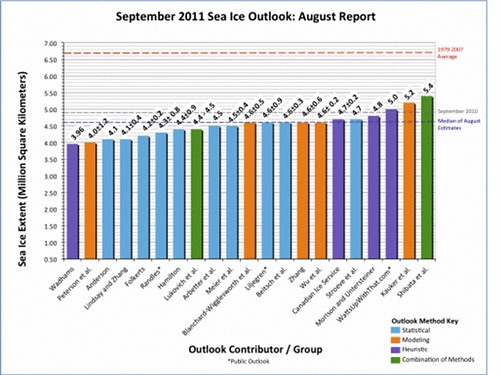
As is often true of a consensus of forecasts, the median for minimum Arctic sea ice extent has been remarkably consistent. June 2011 had a median of about 4.7 million km2, while both July and August 2011 had medians of about 4.6 million km2. The range of forecasts only narrowed slightly over the three months. Ranges using different types of forecasting methods have been surprisingly similar for model, statistical, and heuristic methods. Forecasters who participated in all three months also tended to stay consistent relative to the median values. For example, "WattsUpWithThat" (a "skeptic" blog) was at 5.5 in June, 5.1 in July, and finally 5.0 million km2 in August. As the actual ice extent stayed well below the mean, their heuristic bias methodology drifted lower, but stayed above the median.
The lowest forecast consistently belonged to the model run by Peterson, et al at about 4.0 million km2. Peterson is from the UKMet Office in Great Britain and works as an Ocean Modeler. A description of the sea ice model can be found (warning, PDF) [http://www.arcus.org/... here. In the document, they refer to a problem with the ice being too thin in their initial condition. Such a problem would be consistent with their low forecast results. They did have error bars of ±1.2 million km2 on all their forecasts, which would include the current sea ice extent value.
Where We Stand Now: Final weekend of August 2011
The University of Illinois Urbana-Champagne Cryosphere Today website keeps track of Arctic sea ice concentrations from satellite imagery. The most recent analysis is shown below.
UIUC Arctic Sea Ice Extent, 26 August 2011 (shaded) with 1979-2000 Mean Extent in Orange Contour
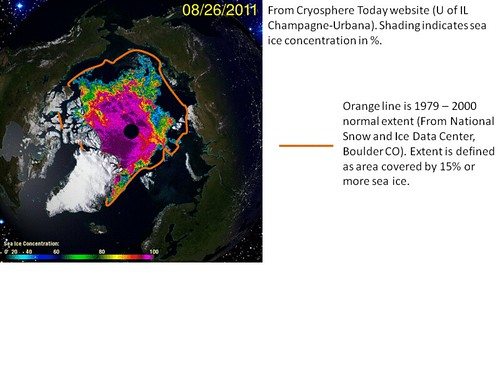
As has been true every summer in recent years, nearly all regions of the Arctic Ocean and environs have below-normal sea ice concentrations (and thus extent). This is in spite of conditions during August that tended to spread out the Arctic ice pack and thus potentially increase extent because of large areas of relatively low concentrations (like we see above with all the blue shading). Sea level pressure departures from normal and wind anomalies and the 925-mb temperature anomalies follow.
MSLP Departures from Normal, 1 - 25 August 2011 with Anomalous Surface Winds
925-mb Temperature Departures from Normal (~3,000 feet above sea level), 1 - 25 August 2011
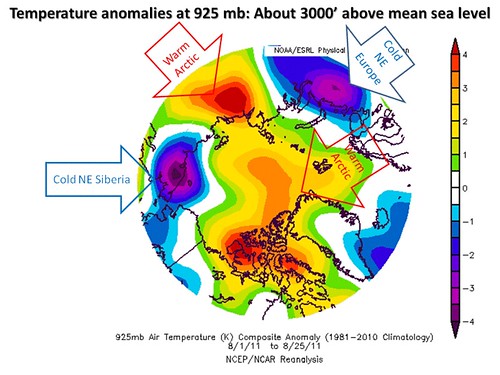
The Warm Arctic Ocean, cold continents pattern we've seen the last few cold seasons may be setting up early; some hints appear in northeast Siberia and northeastern Europe.
Finally, to lend credence to the low concentration/relatively high extent hypothesis, University of Illinois also keeps track of the total sea ice area (adding up the surface area of all those pieces of ice in the Arctic). That graphic is shown below for the period covering the last couple of years.
Time Series of Arctic Sea Ice Coverage, 2009-2011 (Mean, Actual, and Anomaly)
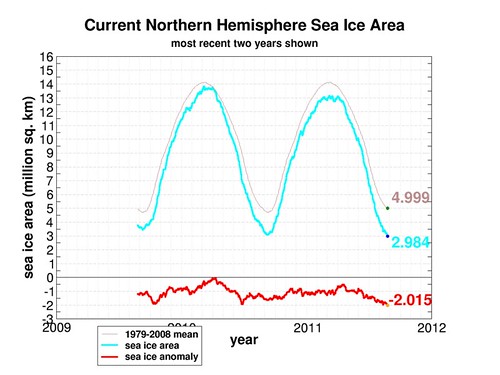
The current sea ice area anomaly is over 2 million km2, the largest anomaly of the period.
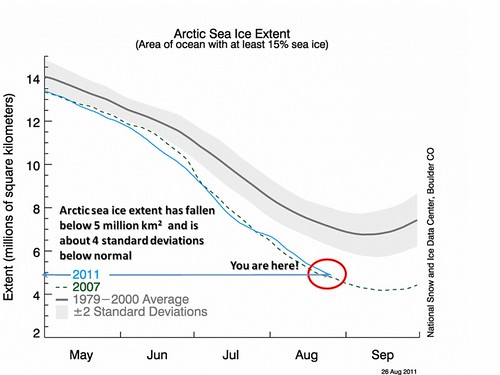
To better see the extent (defined as the areal extent of 15% of more sea ice concentration), I have two graphics from different sea ice monitoring groups: the National Snow and Ice Data Center (NSIDC), and the joint International Arctic Research Center (IARC) - Japan Aeronautical Exploration Agency (JAXA). These are shown next. Areal extent is in millions of km2.
NSIDC Arctic Sea Ice Extent, 1 May through 30 September 2007, 1979-2000 mean, and 2011 (through 26 August)
IARC-JAXA Arctic Sea Ice Extent, Annual Cycle 2002-2010, 1 Jan. - 27 Aug. 2011
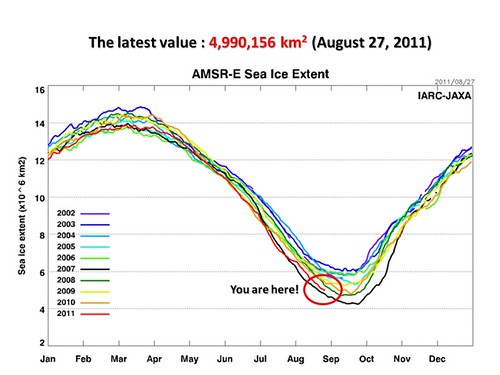
Both groups show current sea ice extent slightly below 5.0 million 2. This is the fourth lowest extent since 1979, with about 2-3 weeks more melting possible, depending on weather conditions. As noted in the sea ice concentrations (and consistent with the weather during August), sea ice is rather diffuse and of low concentration over a fairly large area. Winds that would concentrate the ice would result in a rapid decrease in sea ice extent, particularly if we have poleward winds on the Alaska/eastern Siberia/western Canada side of the Arctic Ocean basin.
The rankings of the lowest sea ice minima over the last 32 years are:
- 2007: 4.254 million km2
- 2008: 4.718 million km2
- 2010: 4.814 million km2
- 2009: 5.250 million km2
I think we may have a shot at the 2nd lowest extent in the satellite record, but again, the final value will be highly dependent on weather conditions during September. Hitting that median forecast from the ARCUS SEARCH program I showed at the top of this post would result in exactly that.
What's to Come: September 2011 and beyond
One of the most telling graphics regarding the disappearance of Arctic sea ice is the loss of ice volume over the satellite observation era that started in 1979. A model of Arctic sea ice that determines its thickness as part of the assimilation of satellite and surface observations of sea ice has been run at the University of Washington's Polar Sciences Center. I've presented results from this model, called PIOMAS (Pan-Arctic Ice-Ocean Modeling and Assimilation System), before as part of my posts. The daily sea ice volume anomaly has been updated through 31 July of this year, and its time series since 1979 is shown below. The linear trend is shown in blue, with uncertainty of the value shaded. Error bars on the volume are shown once per year at the end of that year. I've added a non-linear trend line in red from 2002 on.
PIOMAS Arctic Sea Ice Anomaly from 1979 through 31 July 2011 (km3
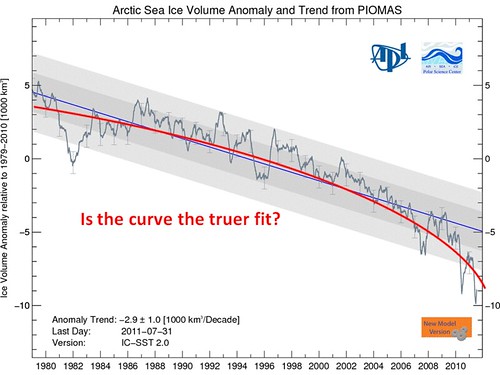
While there's evidence that the sea ice AREA has stabilized, at least temporarily, there has been no evidence of stabilization of the VOLUME. Volume is what must be melted, and it is decreasing at an arguably increasing rate.
The actual values of sea ice volume are shown from 2007, this year through 31 July, and the mean and variability of the volume over the 1979-2008 period below.
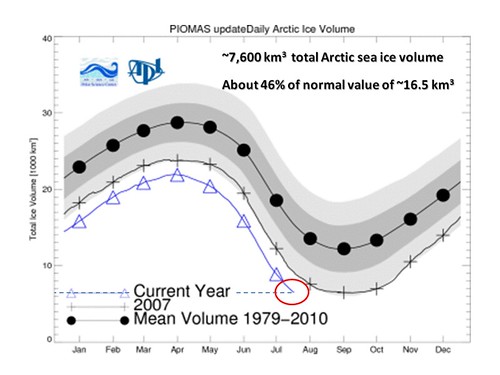
The 31 July 2011 sea ice volume is 46% of normal for the date, if we use the model results as "ground truth".
Much of the melt this year has been from the surface, but some also occurs resulting from above-freezing water coming in via subsurface currents. This final graphic shows the amount of loss through 20 July 2011 from both processes from some of the buoys placed in the Arctic Ocean on the ice.
Army Cold Research and Engineering Lab Point Measurements of Sea Ice Melt Processes, 2010/2011
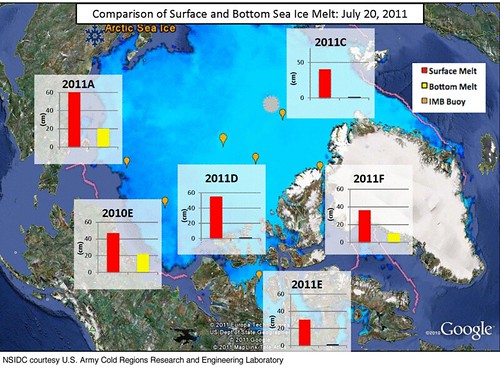
Some scientists are concerned about warm currents bringing water into the Arctic basin, thus resulting in accelerated sea ice loss. The obvious positive feedbacks of reduced albedo, increased absorption of insolation (downward solar radiation), and increased warming of open Arctic waters and the overlying atmosphere would be a major concern.
Stay tuned for the sea ice minimum report, probably in late September.
