This is the 3rd anniversary of the American Recovery and Reinvestment Act, commonly known as President Obama's "stimulus." Republicans say it made the economy worse. Let's see...
House Speaker John Boehner said Thursday, "Today, there's no denying the fact that his 'stimulus' policies not only failed, they made things worse." Presidential Candidate Mitt Romney released an ad that says, "What did we get with all the spending?" text in the ad reads. "24 million Americans struggling for work. Record long term unemployment. 4th straight trillion dollar deficit."
So What Happened?
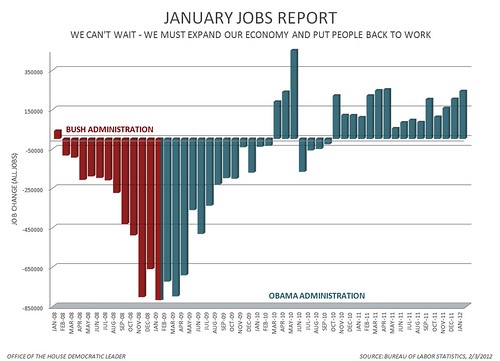
In the following charts, the left side, where it is red, shows how things were going before the stimulus, and the right side, where it is blue, shows the effect of President Obama's policies. Click any chart for a larger view.
Jobs: (the left side, with all the lines going down, down, down, is before the stimulus. The right side, with the dramatic reversal, with all the lines going up, up, up, is the stimulus taking effect.)
Private sector jobs: (the left side, with all the lines going down, down, down, is before the stimulus. The right side, with the dramatic reversal, with all the lines going up, up, up, is the stimulus taking effect.)
Economic growth: (the left side, with all the lines going down, down, down, is before the stimulus. The right side, with the dramatic reversal, with all the lines going up, up, up, is the stimulus taking effect.)
Republicans also say the stimulus caused the debt. So where did the growth in public debt really come from? (Remember, when Obama took office, Bush's last budget had a $1.4 trillion deficit, which Republicans say was Obama's fault.)
PS: see also Three Charts To Email To Your Right-Wing Brother-In-Law
This post originally appeared at Campaign for America's Future (CAF) at their Blog for OurFuture. I am a Fellow with CAF.
Sign up here for the CAF daily summary.