October 2013 Omnibus Week 1
Princeton Survey Research Associates International
for National Journal
Final Topline Results -- October 7, 2013
Total: 1,000 adults age 18 and older
Margin of error: Plus or minus 3.7 percentage points
Interviewing dates: October 3-6, 2013 [in latest sampling]
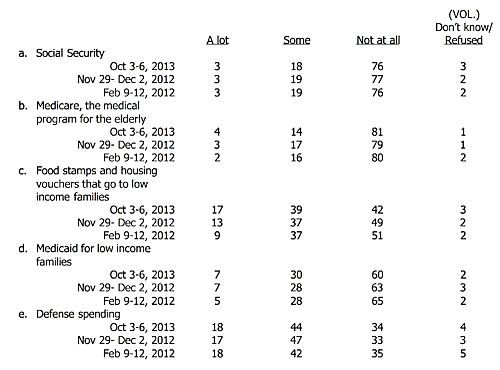
I found the multiple-part Question 5 particularly interesting -- the one about our Government's spending priorities:
ASK ALL -- CC5.
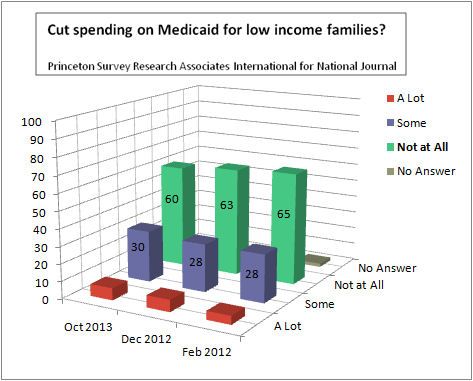
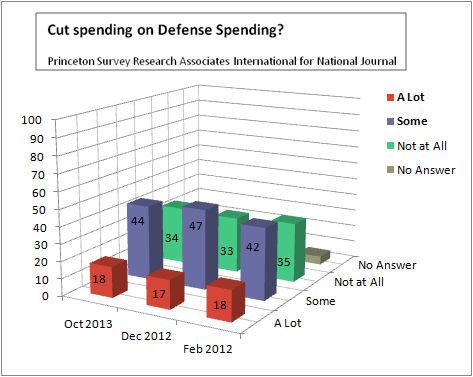
I’m going to read you some government programs whose spending could be cut to reduce the federal budget deficit. As I read each one, please tell me if you think spending on that program should be cut back a lot, some, or not at all to reduce the deficit. (First/Next), what about [INSERT ITEM; RANDOMIZE] [READ FOR FIRST ITEM, THEN IF NECESSARY “Should spending on this area be cut back a lot, some, or not at all to help reduce the deficit?”]
[emphasis added]
[The ITEMS inserted into budget cutting possibilities: Social Security, Medicare, Food Stamps, Medicaid, Defense Spending. ]
Topline Results for Oct. 7, 2013
larger image
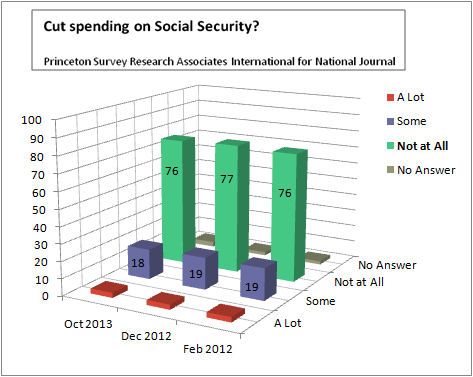
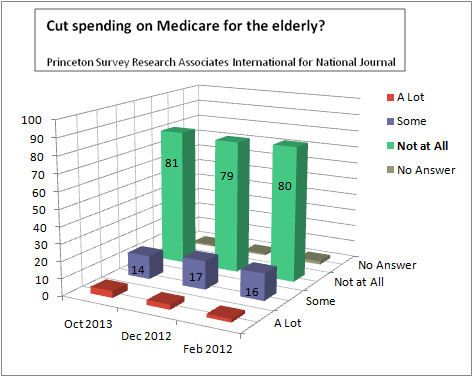
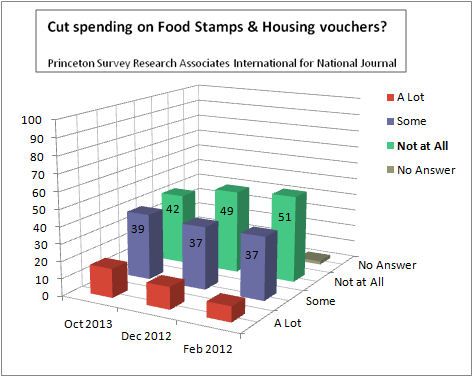
And since I find their [historical] tables of numbers, consolidating the answers to these questions over time, a bit dry and hard visualize ... I decided to spend a few hours converting those answers into some simple to understand charts.
At least I hope they're simpler, and they will help paint the real priorities picture for "average Americans" ... despite all the stern warnings of the "very serious people" to the contrary.
Onwards, over the dkos obfuscation-clearing jump ...
"... some government programs whose spending could be cut to reduce the federal budget deficit ..."
And in just case some want to argue that Princeton is a citadel of 'Liberal Bias' ... here are some confirming "numbers" that back up the fact that the Spending Priorities of 'average' Americans DO in fact lean to the "Progressive" side -- especially when it comes to providing social services like Health Care to all in need ...
Two-thirds of Americans support Medicare-for-all
Posted by Andy Coates, MD, pnhp.org -- Dec 9, 2009
Table 1: Polls indicating majority support for single-payer
…………………………………………………………… For single-payer……..Opposed to single-payer
General public: Polls in which support is 60 percent or higher
Harvard University/Harris (1988)(a) ……………………61%…………..not asked
LA Times (1990)(b) …………………………………………….66%………….not asked
Wall Street Journal-NBC (1991)(c) ……………………….69%…………….20%
Wash Post-ABC News (2003)(d) …………………………..62%………….not asked
Civil Society Institute (2004)(e) ……………………………67%……………..27%
AP-Yahoo (2007)(f) ……………………………………………..65%…………..not asked
Grove Insight (2009)(g) ………………………………………64%……………..28%
Grove Insight (2009)(g) ………………………………………60%……………..27%
General public: Polls in which support is below 60 percent
AP-Yahoo (2007)(f)……………………………………………..54%……………….44%
Kaiser Family Foundation (2009)(h)……………………..58%……………….38%
Kaiser Family Foundation (2009)(h)……………………..50%……………….44%
Doctors
New Eng J Med (medical school faculty and students) (1999)
………………………………………………………………………………….57%…………….not asked
Arch Int Med (doctors) (2004) ………………………………64%…………….not asked
Minnesota Med (doctors) (2007) ……………………………64%…………….not asked
These are some "serious" baseline [historic] trends, that Progressives and middle-of-the-road Dems, would be very wise --
NOT to ignore (as we try to find "our justifications" for our 'BIG Govt programs/solutions'
like Obamacare, going forward).
PS. I have a hunch that the 'average' American hates Insurance Company gouging (and our outsized Defense Spending) -- even more than they "hate" the ACA. ... Best to make use of those 'thrifty' sentiments -- before they get steamrolled into antiquity oblivion.

