There's a lot of talk about how Democrats garnered record support among racial and ethnic minorities in the 2012 Presidential election, but not as much about how strongly white voters supported Republicans. You might be surprised to learn just how conservative the white vote is in some areas, with around nine in ten white voters in the Deep South supporting Mitt Romney in the 2012 Presidential election. That's nearly as polarized as the African American vote. Barack Obama was walloped among white voters in every southern state, and nationally. Among white voters only, Mitt Romney would have won over 450 electoral votes, including New York and California. Most of the information we have on the white vote in 2012 comes from exit polls; there isn't as much actual data on it. That's why I decided to crunch some numbers and get county by county breakdowns on the white vote. We'll start by looking at North Carolina in this diary.
Let's first look at the overall results in North Carolina:
(Thanks Politico)
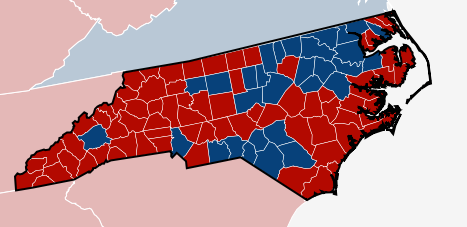

As you can see, it was a pretty close race. Obama won thirty counties, mostly in eastern North Carolina where there is a large African American population. Obama had a very diverse group of voters in North Carolina. According to my estimates he won about 997,000 African Americans, about 1,030,000 White voters, and about 145,000 from other ethnic groups including Hispanics, Asians and Native Americans.
Mitt Romney won seventy counties, largely rural ones. His support was overwhelmingly white. Only about 4% of his supporters were non-white. By my estimates he won about 31,000 African Americans, 62,000 of other minority groups, and about 2,175,000 white voters. That number - 2,175,000 - is less than Obama's vote total. That means Mitt Romney would not have won North Carolina if it wasn't for his support among minorities.
If you take away the African American, Hispanic, Native American, and Asian votes, what's left? This is what North Carolina would have looked like if only white people voted:

Note, those numbers are slightly less than the vote totals I listed above. I'll explain why in the Methodology section of this diary.
As you can see, Mitt Romney won the white vote in ninety-seven counties to just three for Barack Obama. Here's a county by county breakdown:
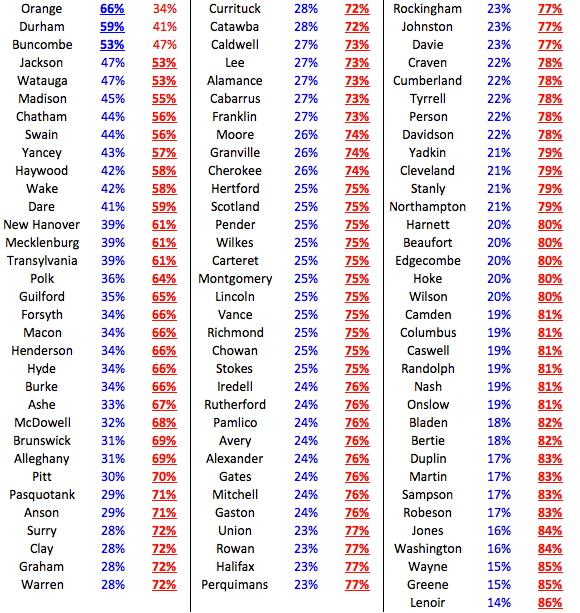
If you're not familiar with NC, that breakdown may seem foreign to you. Orange and Durham are rapidly growing counties located in the Research Triangle area. The liberal white vote in Durham County has developed only in the past decade or so, however Orange County has always been pretty liberal. White voters in Wake County - the largest county in the Triangle - supported Romney by a 58-42 margin. Wake includes a lot of suburban and rural votes that cancel out the more Democratic leaning white votes in Raleigh. Aside from the Triangle, the only other part of the state in which Democrats won white voters was Buncombe County, 89% white and home to Asheville.
The white vote was dramatically different outside of the Triangle and the Mountains. Especially in the "Down East" portion of eastern North Carolina, historically known for "Jessecrats" - conservative Democrats who were the base of Jesse Helms' support in his five U.S. Senate runs. Former Gov. Bev Perdue's gaffe "We look like Mississippi" had some truth to it, because parts of eastern NC do look like and vote like Mississippi. Lenoir County (Kinston) white voters supported Romney by an 86-14 margin. Notice that three of the counties with some of the most conservative white voters are home to large military bases: Onslow (Camp Lejeune), Cumberland (Ft. Bragg) and Wayne (Seymour Johnson).
Now let's look at a few more maps:

This map shows NC's white vote compared to the national white vote, which was 61-39 Romney. It is slightly bluer - notice that white voters in some of the rural mountain counties around Asheville voted at higher rates for Obama than nationally, despite being very socially conservative. New Hanover County (Wilmington), Mecklenburg (Charlotte) and Transylvania (Mountains) are right on par with the nation.
Now, here's a representation of the white vote on a map of the state's thirteen congressional districts (outline thanks to MilesC56)
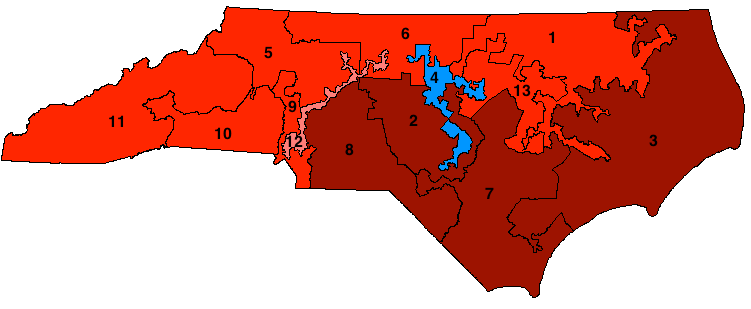
White voters supported Romney in every district but the fourth, even in the I-85 Democratic vote sink.
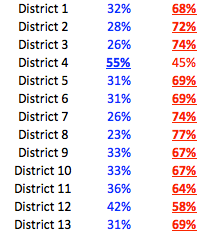
As a bonus, I also calculated the performance of NC's thirteen congressmen (winners' names are shown):
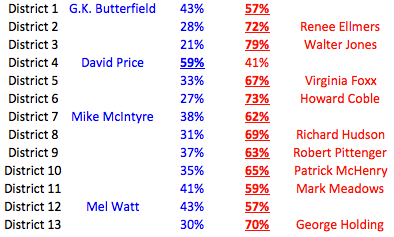
I was surprised by how much support G.K. Butterfield (D-1st) received among conservative white voters. Interestingly, Butterfield, who has a pretty liberal voting record overperformed Obama among whites by the same amount as Mike McIntyre (D-7th), who has a pretty conservative one. McIntyre had a much tougher opponent, though. Walter Jones (R-3rd) was the only Republican to overperform Romney significantly.
METHODOLOGY
I accessed official state voter turnout data here, and plugged in the percentage of white and black votes for each county and congressional district into the two party vote total. I assigned 97% of black voters to Obama in each county. Looking at the "other" votes (not white or black) you see there are several different classifications by the NC State Board of Elections...
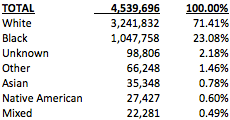
"Unknown" makes up the largest portion of those votes, about 40%. Most of those are white or black voters who skipped the "race" portion on their voter registration form for some reason. However, a large portion are probably Hispanics or some other ethnicity who consciously did not want to register under any of the races listed. I assigned "unknown" votes to Obama by a 60-40 margin. "Other" votes are mostly Hispanics, which I assigned to Obama 67-33, based on exit polls. Asians 62-38 Obama, Native Americans 65-35 Obama and Mixed Race 80-20 for Obama.
----------------------
That's it for this diary, I hope you learned something. Notice this is just "part 1" so there may be more states in the future... but since it took me six months to finally crank out this diary it will probably be awhile if there ever is a part 2. ;)
Happy New Year
