And why we should care?
Here's the Chart:
larger image
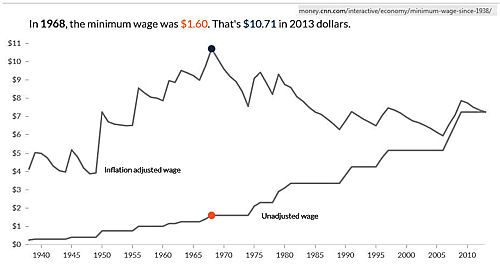
The top line is labeled: "Inflation adjusted wage".
The bottom line is labeled: "Unadjusted wage".
The text at the top says, in reference to the 2 large dots:
In 1968, the minimum wage was $1.60. That's $10.71 in 2013 dollars.
Here's original source for this Chart snapshot, which is quite interactive:
Minimum wage since 1938
from money.cnn.com
And ... Thanks! for your 'two cents' on this little-understood "economic inequity" topic.

