Last week, in Fundamental Understanding of Mathematics LXI, we derived the distance formula from the Pythagorean theorem.
This week we are going to see what running a lemonade stand (mathematicians always seem to know kids who run lemonade stands) can tell us about graphing and functions.
Here's the set up:
Jo and Pat set up and run a lemonade stand. The ice, lemons, sugar and 50 paper cups cost them $7.00. They decide to sell lemonade for 25¢ per cup. How much money do they make?
Right off the bat, we decide we don't have enough information to answer the question, because the answer isn't a number of dollars that we can calculate. The real answer to the question is "it depends on how many cups of lemonade they sell."
As it happens, there are a lot of situations where the real answer to a question is: it depends on something else. When what we want to know (how much money will Jo and Pat make selling lemonade?) depends completely on something else (how many cups of lemonade will they sell?) we say the amount of money made (revenue) is a function of how many cups of lemonade they sell (sales).
Let's take a look at some data, first.
If they sell no lemonade at all, they lose $7.00. The ice melts, the lemonade goes sour, the paper cups are donated to Mom and Dad for the next family picnic. Jo and Pat are out their whole investment. Actually, Jo and Pat drink some of the lemonade while waiting for customers who never show up, so it's not a total loss, but they spent $7.00 and made no money back, so as far as money is concerned, they lose $7.00.
If they sell all 50 cups of lemonade (we assume they planned well, and the lemonade was just enough for the 50 cups they bought to serve it in) then their gross revenue is 50 x 25¢ = $12.50, and if we subtract their initial $7.00 investment, their net revenue is $12.50 – $7.00 = $5.50.
Let's put those two data points on a graph.
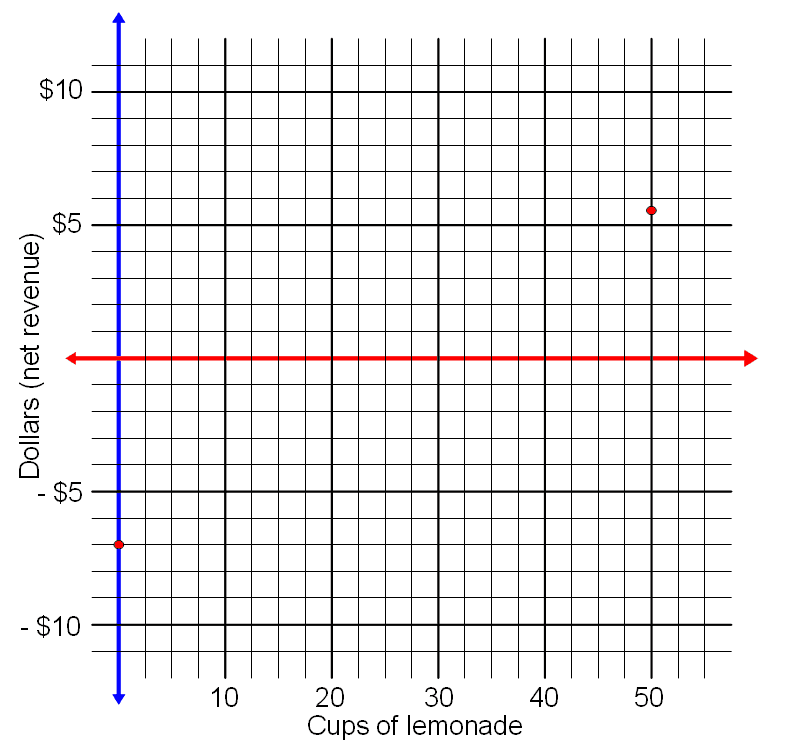
So far, it doesn't look like much, but these two dots represent our best case and worst case outcomes: selling 50 cups or selling 0 cups.
Think about rise and run for a moment. For every cup sold (the run) Jo and Pat bring in $0.25 (the rise.) Since it doesn't matter whether that was the first cup, the 12th cup, the 27th cup, or whatever cup, the rise and the run remain the same, 1 cup for $0.25. This means if we drew a line through all those (as yet uncalculated data points) the slope of that line would be the same everywhere, which means the line is straight.
Now, from geometry, if we know two points on a straight line, we can draw the line. We have our two points, we know the line is straight, here is the line, without further arithmetic.
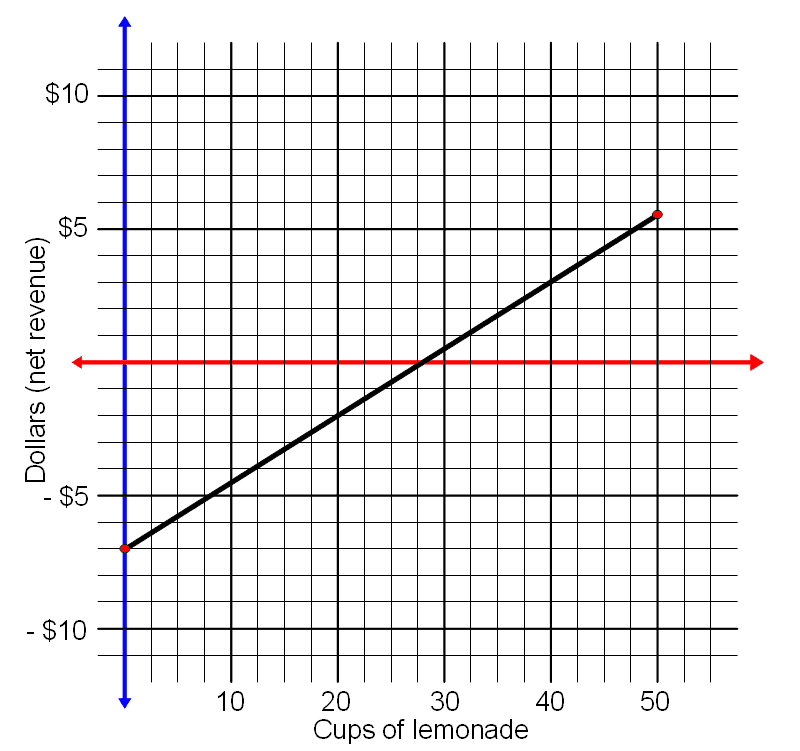
It is a great convenience to get the results of 50 calculations for the effort of doing two calculations and drawing a line, and for this convenience we thank Rene Descartes, who thought up this method.
In addition to saving a lot of tedious arithmetic work, we can also look at the graph and see some relationships that might not have been clear from looking at fifty arithmetic calculations. For example, it looks like Jo and Pat have to sell a bit more than half the lemonade to break even. If Jo and Pat want to make more money, they will have to move the line up (decrease their costs somehow) or make the line steeper (raise the price of each cup.) They could also set a target net revenue, draw a new line and figure out how much they'd have to charge for each cup.
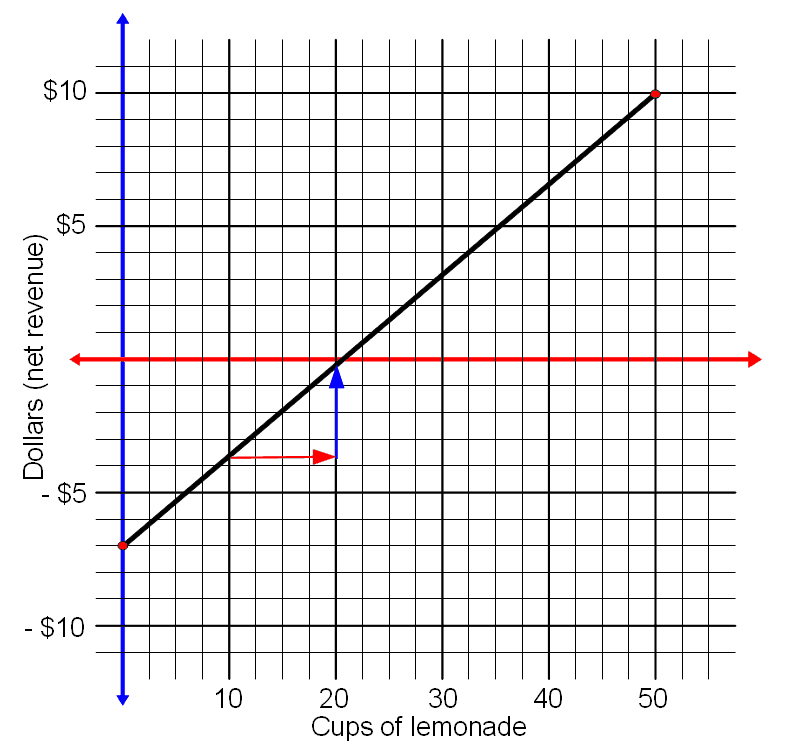
If they want to make $10, they'd have to charge 30¢ per cup (with the increased slope, 10 cups looks like they should cost 3 dollars.)
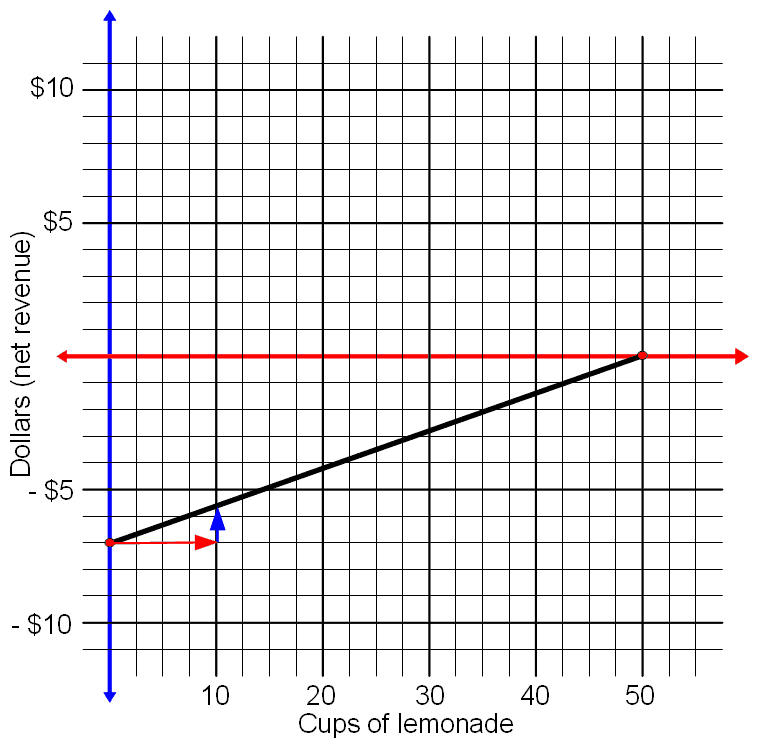
If they wanted to perform a public service, and simply break even at the end of the day, they could charge 15¢ per cup.
Have fun in the comments.
