Inspired by the late Johnny Rook's Climaticide Chronicles, this is an occasional series on the state of Arctic sea ice.
The Arctic sea ice melt season has begun to pick up in pace the last couple of weeks. In fact, the Barrow AK web cam seems to be showing a bit of open water on the horizon (see photo below, and note the dark line near the horizon which may indicate open water). The temperature at the time of this photo, about 7 a.m. Alaska Time, was 29°F. Note that their snow cover is now gone for the summer.
Barrow AK Arctic Sea Ice Webcam, 7:12 a.m. AK Time 28 May 2011

I tried to get the NOAA North Pole camera graphics today, but their website seems to be down. These are set up at the North Pole in April of the melt year and then transmit pictures as the ice floe they're on move around in the ice pack during the melt season. Hopefully, nothing untoward has happened to prevent the pictures from being seen.
Follow me past the jump.
Climate in the Arctic and Northern Hemisphere Extratropics: May 2011
During May, the global circulation is transitioning from its winter to summer flow regimes. Usually there is lots of variability in May as a result, with alternating warm and cool spells. As a result, the temperature and sea level pressure departures from normal persist for less time and any departures that exist tend to be smaller than during the winter months especially. This May has been no exception, with ± departures from normal of only a couple of °C in most areas. The Arctic north of AK was one warmer than normal exception, while southern Greenland, the Davis Strait, and western U.S. were cooler than normal ones. Parts of northern Asia was also considerably warmer than normal, as well as northwest Europe, while the eastern Mediterranean and adjoining parts of northeastern Africa were 2-3°C below normal. The sea level pressure and temperature departures from normal, north of 20°N latitude are shown in the top and bottom graphics below, respectively.
Mean Sea Level Pressure: 1 ‐ 26 May 2011

Mean 925-hPa (about 3,000 feet above sea level) Temperature: 1 ‐ 26 May 2011

State of the Arctic Sea Ice: May 2011 to date
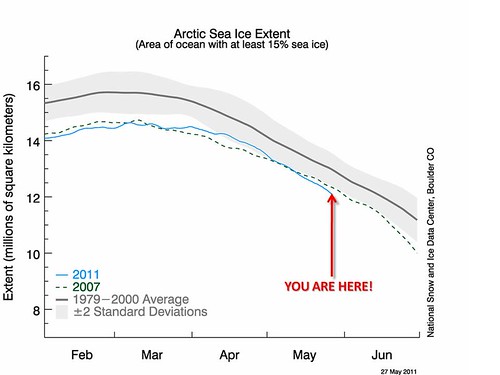
The time series since February 1 for Arctic sea ice extent is below (from National Snow and Ice Data Center. I have the Arctic sea ice concentration map from the University of IL Urbana-Champagne's Cryosphere Today website beneath that.
National Snow and Ice Data Center Arctic Sea Ice Extent, 27 May 2011 (km2)
University of IL Urbana Champagne Sea Ice Concentration (%), 27 May 2011

The loss of sea ice extent has accelerated in the last week or two, and has been more rapid than the 1979-2000 average (bold grey line). We can see that current sea ice extent is below the 95% confidence band indicated by the grey shading.
In the sea ice concentration graphic, I've highlighted areas that experienced significant recent ice loss. We can connect some of that to the temperature and wind anomalies in the previous section north of AK, and to temperature in the area north of central Siberia. Offshore flow from the south has been pushing ice away from the AK Arctic Ocean coastline; above normal temperatures north of Russia has been melting the ice in that region more rapidly than normal.
As to the near-term future, the Arctic Oscillation, which when active in one phase or another can have major impacts on both Arctic and mid-latitude weather, is expected not to be a major player in the next two weeks. Given the relative thinness of the ice as evidenced by the increasingly low sea ice volume as shown below (through 2 May 2011), even normal weather for the summer will likely result in very low Arctic sea ice extent.
Northern Hemisphere Arctic Sea Ice Volume, 1979 through 2 May 2011
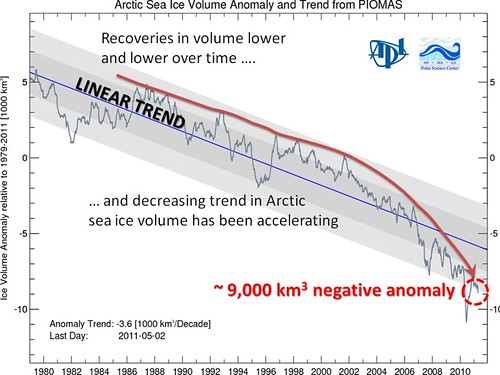
The developer of the PIOMAS sea ice volume model (the source for the data above), Jinlun Zhang of the University of Wachington's Polar Science Center, has issued a "first forecast" of minimum Arctic sea ice extent for this melt season. The forecast was blogged here. He expects the minimum to be 5.0 million km2, a bit more than last year. If this figure verifies, that'll put 2011 at the 4th lowest sea ice extent since 1979, and the five lowest sea ice minima will have been over the last 5 years.
World Drought
There's some good news according to these maps from the World Drought Monitor out of University College of London, though it may be too late for this year's harvest. Drought conditions seem to have improved (lower map) this past month in areas of the U.S. Great Plains (at great cost, with severe weather), Africa, and China. Drought continues unabated in Europe.
6-month World Drought Index, May 2011

1-month World Drought Index, May 2011

But the actual news stories out of areas where the maps are showing improvement is grim. Kansas is showing winter wheat losses of almost 100% in some areas; even where irrigated, loss of yield is on the order of 30-40%. Wheat is fetching about $9/bushel and is expected to go as high as $10/bushel soon. In China, news is that the drought will continue through early June, and is contributing to major food price inflation.
Summary
Food supplies are hurting, though there has been improvement in some important regions such as Russia and Australia. Arctic sea ice extent continues to be far lower than normal, and I expect this summer will produce another record minimum volume, even if the area coverage does not.
It's been hot here in Maryland in the last few days. May 2011 will mark the 4th consecutive month of above normal temperatures here. It's been colder than normal in other areas of the U.S., particularly out west, so we cannot make generalizations from individual areas over a short time period. That's something I never tire of pointing out ... since we are the so-called reality-based community :-).
There'll be a NSIDC report on May 2011 Arctic sea ice extent and the weather conditions during that month that contributed to what was seen; I'll write a diary on that when it is issued.
