You can’t hide the data. Better you see the whole truth about jobs — at a new site, at https://demomentum.com . In short, it’s got visualizations of Unemployment, jobs, and the economy. In a few simple charts: it is not a TL;DR kind of a site.
The banner for it looks like this. You can think of this as either demomentum, or Obamomentum, or Obama-Joementum. More on that at the bottom, for who can get credit.

It’s a view of the economy's expansion when the Democrats held the White House,
the recovery from the last recession and financial crisis of ‘07-’09
and since then ... ...
Covering unemployment and Jobs ...
and GDP (just for the fun of it) ...
MANUFACTURING EMPLOYMENT took a sharp climb upward — in 2010.
-- The turnaround in these jobs since 2010
were the 1st gains since the 1990s.
Factory jobs peaked previously in 1979, at 19 million jobs.
Here’s another view of a very similar chart, of factory employment. This one comes straight from the Bureau of Labor Statistics (instead of via St. Louis Fed).
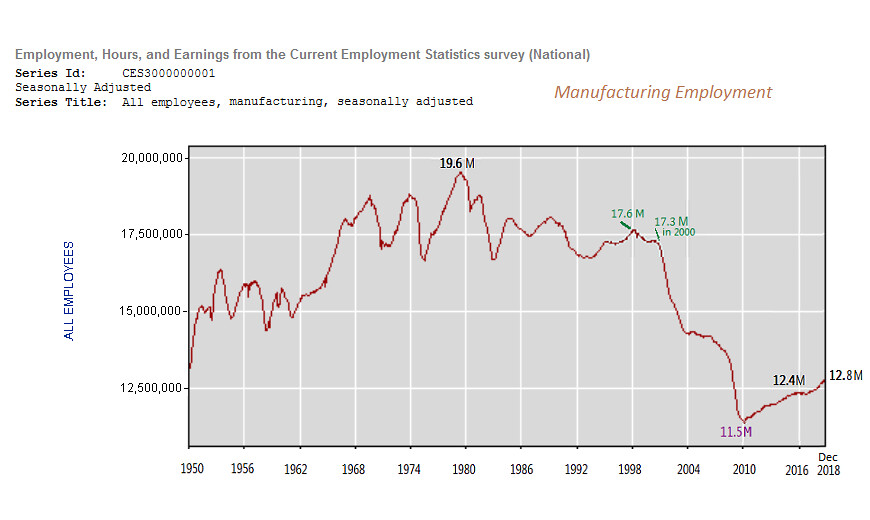
A slide in blue-collar jobs, since 1980, accelerated in the decade from 2000 to 2010, when the economy gave up 6 million manufacturing positions.
Since 2010, the U.S. succeeded in adding nearly 1 million jobs in manufacturing industries through 2016.
Through 2016 it was the first sustained upturn in Mfg. jobs since the mid-1990s. Jobs in manufacturing grew to 12.4 million workers at the end of 2016, up from its bottom of 11.5 million in 2010. The upward trajectory of manufacturing jobs is continuing under Trump.
Unemployment Rate
Here is the trend-direction, over a decade, of UNEMPLOYMENT shrinking, as shown at the end of each year, and through year-end 2018
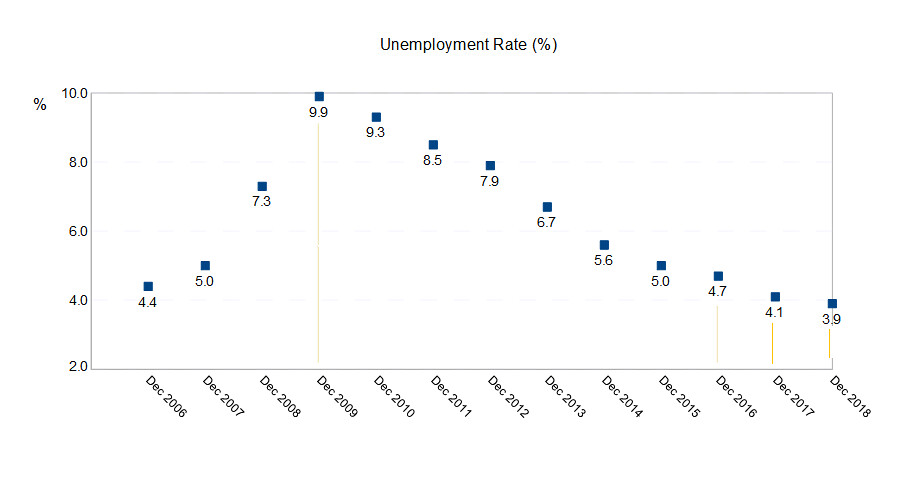 Year-end data: Bureau of Labor Statistics (seasonally adjusted, monthly data)
Since the end of 2009, unemployment
has shrunk each year, from about 10% of the workforce down to
4.7% when President Obama finished his term.
Since Trump took office the unemployent rate has
fallen from 4.7% to 3.6% (in April 2019)
For Black/ African-American workers, the UNEMPLOYMENT RATE, through year-end:
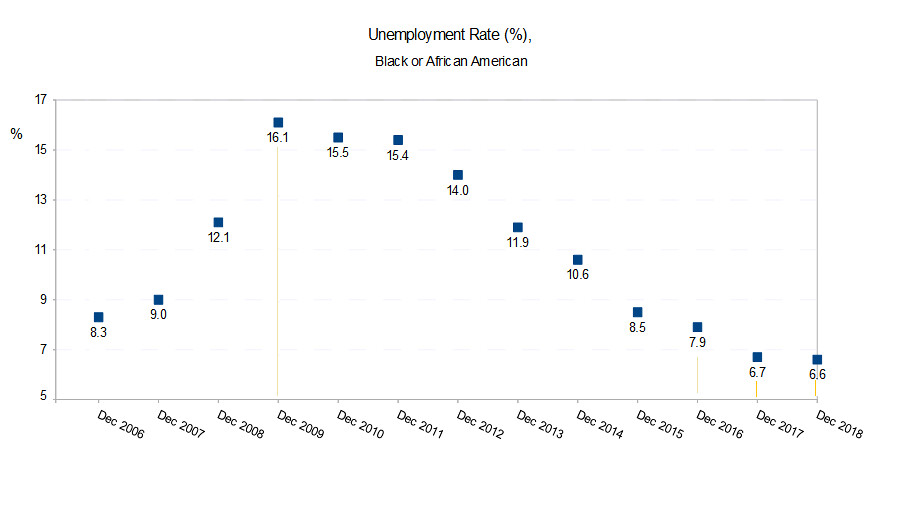 Year-end data: Bureau of Labor Statistics (seasonally adjusted, monthly data)
Most recent report for April 2019: 6.7% for Black/ African-American unemployment rate
Here’s the chart of ANNUAL average job growth (in thousands [000]), since 2010 - from the Federal Reserve Bank of St. Louis website ("FRED" website), taken from BLS data:
 ANNUAL EMPLOYMENT GAINS (thousands of persons)
These are the number of new jobs in each of the last four years: > >
Millions of new jobs:
2015 2.885 M;
2016 2.522 M;
2017 2.263 M;
2018 2.454 M
The gain in jobs in the prior 2 years (2,885,000 in 2015 and 2,522,000 in 2016)
were larger than the gains
of the last 2 years ( 2,454,000 last year in 2018, and 2,263,000 the year before, in 2017).
Here is a graph of Job growth, shown below, averaged over quarters (from the monthly reported figures),
Growth of total payroll employment (thousands of workers) has been no speedier during the last 2 years than in the years preceding.
 QUARTERLY EMPLOYMENT CHANGE (thousands of persons)
Also, see the much bally-hoo'ed GDP [gross domestic product] grew last year 2.9% in 2018, from 2017.
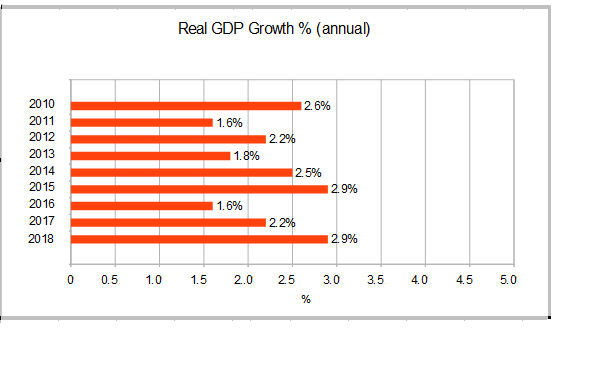 Data: Bureau of Economic Analysis
The annual growth rate is shown above. Last year's economic growth was the fastest since, well, ... 2015.
Quarter-over-quarter growth is shown below.
Looking at the employment and GDP growth data, how do you assign credit where credit is due?
We can perhaps credit the lawmakers who turned around the 2007-2009 financial crisis and recession by voting to approve the American Recovery and Reinvestment Act of 2009 (ARRA), when the financial and housing markets were cratering, as George W. Bush exited the presidency.
– Credit Congress for voting it through, CREDIT PRES. OBAMA for pushing it through (we can call the last 9-10 years of recovery Obama-mentum).
– Credit Obama and his vice-president, Joe (call it Joementum).
– Credit their leadership, can call it Demomentum, too.
Looking at either the annual growth in GDP, or the recent quarterly numbers, it's clear that the promised revved-up 5%, or 4% or even 3+% accelerated rate that the 45th President promised for sustained growth has not come to pass.
And that's even in the aftermath of the much-touted tax bill of 2017.
For Trump, it's a born-on 3rd base economy.
And he thinks he’s hit a home run.


