This is another in a series of pictures showing what this year's blue wave looks like. So far, I've done New England and these Mid-Atlantic states individually. Each congressional district has equal size here. I know I said on Sunday that Ohio would appear today, but Ohio should appear tomorrow. (Really.)
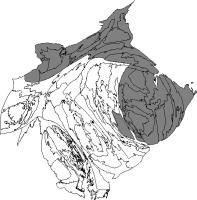
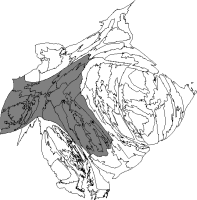
Here's how things stood before the 2006 election.

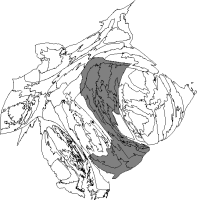
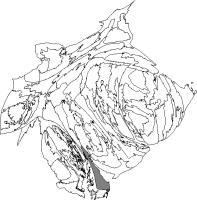
Here's how thing came out on Election Night. There weren't any targeted seats here, and nothing changed. (Sloppy cut-and-paste.)

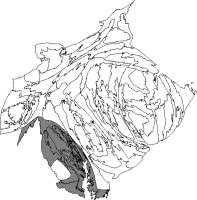
Next is a map showing the margin of victory.
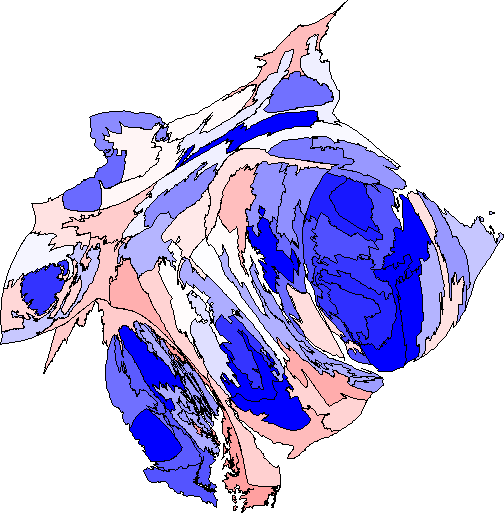
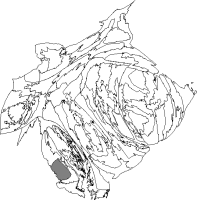
Finally, here's a map showing the margin-of-victory change from 2004 to 2006. Only six districts on the region are any shade of red, and three of those were unopposed in 2004.

Here are thumbnails of the states and DC. My favorite ordinary maps of congressional districts are from the Census Bureau and the Interior Department.
New York, 20 D hold, 6 R hold, 3 D pick-up:
New Jersey, 7 D hold, 6 R hold:
Pennsylvania, 7 D hold, 8 R hold, 4 D pick-up:
Delaware, 1 R hold:
Maryland, 6 D hold, 2 R hold:
District of Columbia, 1 D delegate hold:
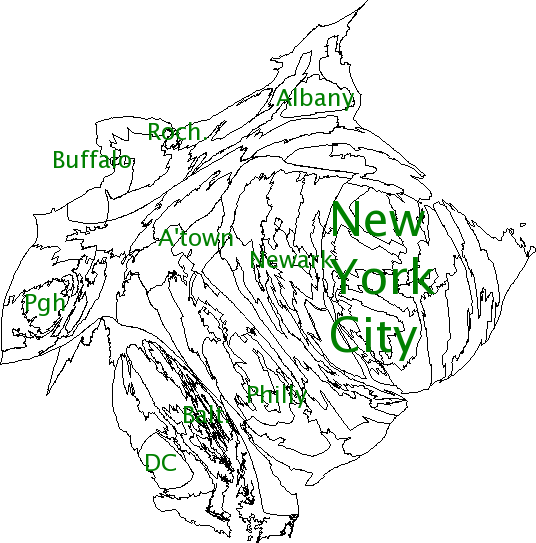
For reference, here's the region with select cities labeled.