For the past few days, debate has raged over whether 70% of self-identified blacks in California voted for Proposition 8 (as the major-media exit poll indicates), what it means, whether we should care, etc. It's an emotional subject, and I don't hope to add much profound insight to the discussion -- but I'm presenting some data I haven't seen elsewhere.
I've spent some time over the last 24 hours mashing up preliminary precinct-level results and demographic data from Los Angeles County. If forced to guess right now, I'd guess that somewhere around 62% of black voters in LA County voted for Prop 8. I will show you why I think so -- and, very tentatively, tell you why I think it matters -- over the jump.
To review, the exit poll estimate for black voters in California is especially suspect because black voters make up a fairly small proportion of the electorate and tend to be concentrated in certain precincts. One can only learn so much from a few hundred interviews, most of them conducted in a handful of precincts. So it is very desirable to look at some election data.
Data analysis
I decided to examine Los Angeles County because (1) it has the third-highest proportion of African-Americans in the state; (2) it is very large and has a lot of demographic variation; and (3) the data I needed were available, more or less. Of course, there is no guarantee that black voters in L.A. County voted just like black voters from elsewhere in the state.
My unit of analysis is a precinct, not to be confused with a "subprecinct." L.A. County has something like 4600 precincts, and I was able to rip preliminary vote counts for them from a 3500-page PDF "Statement Of Votes Cast" (part 2, available here). UC Berkeley has extensive archives including precinct shapefiles for 2006 (see here, which I clipped to L.A. County and dissolved to the precinct level. Then I downloaded block-level Census 2000 data and shapefiles from ESRI. Basically, by overlaying the precinct boundaries on the block boundaries, and making mildly heroic assumptions, I can estimate various demographic proportions (as of 2000) for every precinct. (These proportions include everyone recorded in the Census, regardless of age.) Here I depict the proportion who self-identified as black only. Lots of things can go wrong here -- including precinct boundary changes, demographic shifts, changes in the preliminary vote tallies, or even parsing errors that I haven't spotted yet -- but the results look pretty reasonable.
This sort of "ecological" analysis of aggregate data cannot tell us how individual voters voted. (Weird fact: if one plots % black by per capita income across states including D.C., the slope is positive. This does not mean that blacks have higher incomes than whites: it basically means that there are a lot of black residents in certain states with high per capita incomes. Moral: this sort of analysis is risky.) These results do provide some hints.
Results
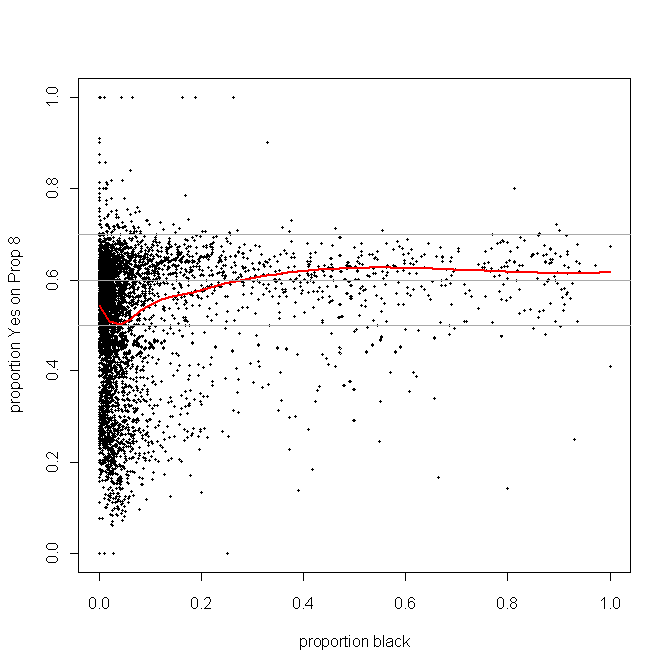
Basically, this scatterplot indicates two things.
The red smoothing line indicates that average support for Proposition 8 increased from around 50% in precincts with very few blacks (closer to 55% in those precincts with almost zero blacks) to 60% or a bit higher in precincts where more than about 1/3 of the population was black. (I have put gray horizontal lines at 50%, 60%, and 70% to improve readability; these lines don't have any hidden statistical meaning.)
The points indicate a very wide variation in support in the precincts with the fewest blacks, and somewhat less variation in other precincts. In LA County, as far as I can tell, precincts with 70+% support for Prop 8 generally had rather few black residents.
I've prepared similar plots for % Hispanic and % Asian, and they are qualitatively rather similar. Given all the pitfalls of the analysis, it might be more confusing than helpful to 'walk through' the plots, but they certainly don't provide grounds for singling out black voters as the key to Prop 8's success.
So what?
I won't tell anyone else whether or why he or she should care what proportion of black voters voted for California Proposition 8. For me, honestly, if the proportion were as high as 70%, I would be (more) depressed. (Never mind whether that's a rational judgment.) Based on this analysis, I very much doubt that the proportion was anywhere near that high, at least in L.A. County. From this perspective, race doesn't seem to have mattered that much. On the other hand, if the exit poll is correct that almost four in five white Democrats voted against Prop 8, then the contrast is striking.
This much I can say: analytically, it's a mistake to depict "black voters" as a monolithic bloc on this issue. Clearly they were not.
