In June 2007, the New Zealand online publication Scoop published an article by Michael Collins called "Election 2004: The Urban Legend." (The article is now a chapter in Mark Crispin Miller's edited volume Loser Take All.) The actual argument of this article is open to interpretation. Here is what Ernest Partridge of "The Crisis Papers" thinks it means:
In a stunning essay, read by very few, Michael Collins explains how they did it. The DRE machines switched and stuffed millions of GOP votes in the big cities, where they would be least likely to be noticed. Collins’ evidence is compelling.
Actually, Collins never mentioned DREs. In brief, the article notes that one table from the 2004 exit poll tabulation reports too many big city voters -- and, therefore, too many big-city votes for Bush. So what? The closer one reads, the harder it is to tell. But Mark Crispin Miller seems to think it's important, so if you're curious, read on with me....
First a brief meta reminder. This diary -- as should be obvious -- is not about whether electronic voting is safe (it isn't) or whether voting rights are secure (they aren't). If you're the sort of person who thinks that any argument about election fraud is good if it gets attention, well, I hope you're right. So, here I am, bringing attention to it. Personally, I think it's lousy.
Here (slightly reduced) is the screen shot that launched Collins' 7,000-word essay:
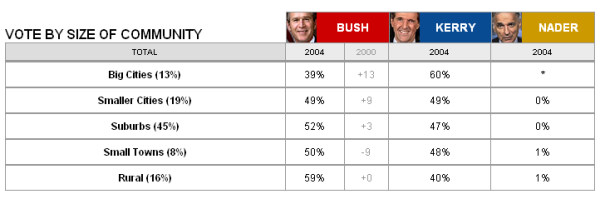
Two things here are noteworthy. One is the grey "+13" in the Bush 2000 column: this means that Bush's estimated vote share in the "big cities" increased by 13 points, from 26% to 39%. That is dramatic by itself, but its effect is multiplied by the second point, the "Big Cities (13%)" -- i.e., according to this table, 13% of voters voted in big cities. This figure was up from just 9% in 2000. Factoring in the turnout increase (and some rounding error), Collins reckons that turnout in big cities increased by 66% from 2000 to 2004. He further reckons that Bush's vote total in the big cities went from 2.7 million votes to 5.9 million -- or maybe from 2.3 million to 5.9 million -- or maybe from 2.3 million to 5.4 million: all three claims appear. Since Collins says that the numbers represent a 153% increase, he probably means from 2.3 million to 5.9 million. In any case, it looks like a lot of votes. (If you are wondering how you missed Bush's boffo numbers in Cleveland, Miami, or even Houston, well, you may be on to something.)
Collins isn't content just to report these numbers; he offers a dramatic narrative in which Bush's rural and small-town vote stagnated, his suburban performance was mediocre, but the cities -- especially the big cities -- improbably bailed him out. Collins writes things like, "No one anticipated that [white turnout] would materialize for Bush in the big cities in the way that it did"; the premise that it did materialize for Bush is unexamined. You might want to ask: "materialized" where? In real life? In the official returns? In the exit poll data? In a particular exit poll table?
Here is Collins' apparent answer:
Where then did the Bush swing in the urban wave come from? The simple answer is that it was weighted into existence. The act of reconciling the exit polls to the official vote count created it. The Bush urban voters came into existence because they had to... otherwise the official vote count would be wrong.
You might suppose this means that the official vote totals gave Bush over 5 million votes in big cities. After all, the exit polls were matched to the official vote count, right?
Here is where "Urban Legend" becomes almost surreal. Collins, to his credit, checks some of the big-city turnout figures, and finds -- of course -- that turnout didn't increase by 66%. In the twelve cities for which he obtained data, the increases ranged from about 8% in Chicago to 21% in Denver, averaging about 15.7% overall. Collins comments:
The explanation of the Bush victory margin through the 66% big city increase evaporates in view of this data. 16% is not even close to 66%. The 66% did not happen. All those white voters are phantoms, ghosts, artifacts born of necessity.[...]
How did the NEP get it so wrong on the urban vote? Was it simple expediency? They had an election to report. They had that 3% problem to handle, you know, the Kerry 51%-48% victory at the end of the day’s polling. There was very little time to handle it. The urban magic that Charles Cook extolled as a sign of Bush campaign genius was invented. It came to be because it was the only way the poll could match the reported results.
In words of one syllable, this makes no sense. No one (including Charlie Cook) ever tried to explain Bush's victory margin through a 66% increase in big-city turnout. If one were looking for a place to invent millions of voters, the big cities would be a strange choice, since Bush did worst there. (I have no clue what Partridge is thinking when he asserts that millions of Bush votes would be "least likely to be noticed" if they were concentrated in big cities.) Not only was this not "the only way the poll could match the reported results," but Collins just proved that the poll doesn't match the reported results.
Worse, we know that the 66% increase in big-city turnout could not have been invented to "handle" the exit poll discrepancy, because the exit poll showed this increase in turnout before official returns began to arrive. Here is a PDF of the national exit poll tabulation as of about 7:30 PM Eastern on election night. If you scroll to the bottom of page 11, you'll see that it already shows the big city vote as 13% of the total vote. Yet this same tabulation (on page 1) indicates that Kerry is ahead by 3 points. One can only wonder whether Collins never knew this fact, or chose to ignore it.
The increase in Bush's vote share from 26 points to 39 points seems unlikely, too, even going by the official returns. It is not easy to piece together big-city vote totals, but Bush's reported vote share increased by 6 points in New York City; by 9 points in Los Angeles; by 1 point in Chicago; by a fraction of a point in Harris County, Texas (which contains most of Houston); and by about 1.3 points in Philadelphia County. One begins to suspect that the national exit poll tabulation is way off when it comes to big cities.
I do not know why the tabulation is so far off, but something to consider is that the national tabulation is based on a subsample of the full exit poll. The exit poll was fielded in over 1400 precincts around the country; the national subsample used 250 of these precincts, including a few dozen big-city precincts. Using a few dozen precincts to represent a few dozen cities is not guaranteed to go well under the best of circumstances, and evidently it didn't. Probably the exit pollsters would have gotten better results if they had drawn on the full sample, although that would not be easy.
I've seen a bunch of bad exit poll arguments (see my diary here for some comments), but I can't think of one that goes to such lengths to portray evidence that the exit polls were wrong (at least with respect to this table) as evidence that the official results were wrong. Of course, one can debunk dozens of arguments that the official results were wrong without learning how accurate those results actually were. Getting the bad arguments out of the way just might help us to focus on the good ones -- or, perhaps better yet, on how to fix the system so that we don't have to do this after every election.
