From time to time I examine allegations of electronic election fraud. There’s no question that such fraud is possible: computers can yield incorrect results in the blink of an eye. Unfortunately, the arguments for fraud in particular instances often are painfully naïve. Take the case of the 2010 special U.S. Senate election in Massachusetts. Jonathan Simon of the Election Defense Alliance writes in "Believe it or Not":
Where votes were observably counted by hand, the Democrat Martha Coakley defeated the Republican Scott Brown by a margin of 2.8%; where votes were counted unobservably and secretly by machine, Brown defeated Coakley by a margin of 5.2%.
Simon doesn't stop there. He claims to address and rebut "the last-standing 'benign' explanation for the handcount-opscan disparity" (p. 5), concluding that the disparity "stands as an unexplained anomaly of dramatic numerical proportions" (p. 6).
This is silly. By all means Massachusetts should have provisions for checking the accuracy of its scanner counts, but Simon's alarmism about the Senate special election isn't supported by the evidence.
Let's start with the meta
At the risk of stating the obvious: This diary doesn't argue for blind faith in optical-scan election results. (There is at least one undisputed case in which an optical scan error would have altered the election outcome had it not been detected and corrected.) It addresses specific arguments about the special election in Massachusetts. If you aren't interested in that topic, so be it. If you think that it is objectively wicked to express skepticism about election fraud arguments, good luck with that.
Simon's argument
Simon compares selected data from what he calls "Handcountville" -- the 72 cities and towns that did hand counts -- and "Opscanshire" -- the 279 communities that used optical scanners.1 Simon first examines registration figures, and finds that Handcountville is substantially more Republican by registration than Opscanshire. He notes, however, that slightly over half of registered voters are not enrolled in either major party. He says, "Without knowing more about the unenrolled voters in each meta-jurisdiction, reaching beyond this impression to a conclusive quantitative characterization is not feasible" (p. 4). Actually, we can reach one "conclusive quantitative characterization" right away: Handcountville isn't just like Opscanshire.
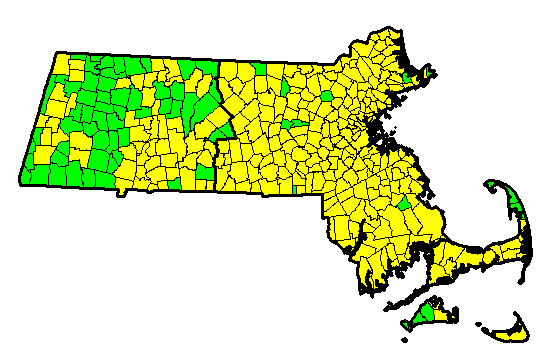
That should come as no surprise if one looks at a map. In this map, hand count communities are in green and op-scan communities are in yellow. Note that 56 out of 72 communities in "Handcountville" are west of the dark line; six of the remaining sixteen are on Martha's Vineyard or the tip of Cape Cod. It would be surprising if adding these places together somehow produced a microcosm of the entire state.
Nonetheless, Simon argues that in some respects, at least, it does. He notes that in both the 2006 and 2008 U.S. Senate elections (in which John Kerry and Ted Kennedy, respectively, won reelection), the vote shares in Handcountville were within a point of those in Opscanshire. Simon writes,
In each of these statewide senatorial elections, Handcountville and Opscanshire exhibited virtual political congruence, much as we would expect if indeed Handcountville votes were a random sample of the state as a whole, establishing baseline expectations for the political divisions of the two meta-jurisdictions in similar contests such as the 2010 Massachusetts Special Election. In fact, when we combine the vote totals for the previous two Senate elections (2006 and 2008), we find exact congruence between the voters of Handcountville and Opscanshire, as shown in Table 3. [p. 4]
Kerry and Kennedy, combined, won 68.7% of the two-party vote in both imaginary regions. That's a nifty coincidence -- but it doesn't make Handcountville votes anything like "a random sample of the state as a whole," notwithstanding Simon's handwaving.
(Simon earlier says, "Had these [hand-count] ballots been distributed randomly throughout the Commonwealth, we would expect the handcount results to fall within 1.0% of the opscan results with better than 99.9999% confidence" (p. 3). Yeah, and if I had a dollar for every irrelevant statistical claim, I would be set for life.)
I'm almost done summarizing Simon's argument. His last point is that, similarly, when Coakley ran for attorney general in 2006, she ran slightly better in the op-scan jurisdictions than in the hand count communities. Simon asserts that this fact is highly significant because
it is incumbent upon our analysis to consider what would be the last-standing "benign" explanation for the handcount-opscan disparity and Coakley's Handcountville victory: that Handcountville impounds relatively more western towns near Coakley's old "home base," and that her Handcountville victory therefore reflects nothing more insidious than a "favorite daughter" phenomenon at work. [p. 5]
To summarize: Kerry, Kennedy, and Coakley (in 2006) all did about the same in "Handcountville" as in "Opscanshire," and Handcountville is more Republican by registration -- yet Coakley in 2010 did much better in Handcountville than in Opscanshire. That's highly significant, isn't it?
Umm, probably not. Plenty of benign explanations for the election results are still standing.
East versus west
There are some pretty sophisticated methods for analyzing spatial data, but for purposes of this diary I will mostly ignore them.2 Let's just distinguish between western and eastern Massachusetts, using the somewhat arbitrary black line I drew on the map above. Obviously "eastern Massachusetts" is no more politically uniform than "Opscanshire" is, but more elaborate approaches don't fit in a diary (except for the footnote). Here are some summary statistics for various candidate margins by region and counting method:
			Western Mass.	     Eastern Mass.
		      W/HCPB   W/opscan    E/HCPB   E/opscan
Kerry margin '04      +27.7%	+32.0%	   +25.6%    +24.2%
Kennedy margin '06    +40.2%	+43.2%	   +38.2%    +38.4%
Patrick margin '06    +36.5%	+32.5%	   +20.0%    +18.5%
Kerry margin '08      +43.8%	+46.3%	   +32.5%    +34.5%
Obama margin '08      +33.9%	+35.5%	   +26.8%    +24.4%
Coakley margin '10    +11.0%	+ 7.2%	   - 1.9%    - 6.8%
(Bear in mind that these percentages are
margins. Going from 50%-50% to 51%-49% is a two-point change in margin. Also, these are actual percentage margins, not averages -- so large cities have much more influence than small towns. There are a bit more than 60,000 hand-counted ballots, divided almost equally between west and east, out of some 2.2 million total ballots cast.)
I see three basic results here: (1) There's a definite, but variable, difference between west and east. (There is little difference between west and east in the party registration statistics.) (2) More often than not (in these cases, at least), there's at least a 2-point difference between hand-count and op-scan results within each region. (3) Controlling for east versus west cuts the apparent Coakley "machine effect" from 8 points to about 4-5 points -- similar to the apparent Western "machine effect" in John Kerry's favor in the 2004 presidential election, or the Western "machine effect" against Deval Patrick in 2006.
It's at best a stretch, then, to call the result in 2010 "an unexplained anomaly of dramatic numerical proportions." Still, couldn't that almost 5-point difference for Coakley in the east be a sign of miscounting? In one sense, the only possible reasonable answer is: No, the total vote counts from sixteen towns such as Aquinnah, Chilmark, Provincetown, and Wellfleet can't plausibly be treated as a "sign" of miscounts in, say, the Boston suburbs. But if the question is whether the scanners could have miscounted, then the only possible reasonable answer is: Yes, they could have, although there is no obvious reason to think that they did. Bear in mind that almost every late pre-election poll showed Brown leading Coakley; it wasn't a great shock when he won. Nevertheless, without any external verification, the accuracy of the count is unknown.
Without going too far into the details, comparing the 2010 results with the 2008 results shows that Coakley underperformed in many of the medium-sized cities -- Lowell, Lynn, Springfield, Worcester, Fall River. These tendencies didn't surprise many political observers. However, it would be a wonderful thing if Massachusetts had mandatory post-election vote tabulation audits, in which hand counts of some of the ballots would be compared with the original machine counts. It's one thing to argue about whether the results are predictable or wildly anomalous; it's another thing to know whether the results correspond with the ballots. Well-designed post-election audits can tell us. (I'll say much more about that in future diaries.)
----------------
Footnotes
(1) Simon states that 71 communities used hand counts, but his dataset lists 72. VerifiedVoting.org's Verifier yields the same count.
(2) Herron, Mebane and Wand (2008) analysed data from the 2008 New Hampshire presidential primary by matching similar pairs of hand-count and op-scan wards. Unfortunately, all the large cities in New Hampshire use op-scan, and large-city wards generally can't be matched with hand-count towns.
Using spatial simultaneous autoregression as implemented in the spdep R package (the spautolm function), I found that (1) neighboring jurisdictions tended to have similar vote shares (doh), and (2) controlling for that spatial autocorrelation, the counting method wasn't a significant predictor of Coakley's 2010 vote share. That basic result held when I controlled for various demographic variables, or none at all. However, this result does not prove very much: in principle, a clever attacker could simply steal more votes in op-scan places that don't border hand-count places than in those that do.
A simpler approach is to look for every pair of neighboring towns that use different methods -- hand-count in one, op-scan in the other -- and examine the results in these pairs. It turns out that Coakley did a bit worse in the hand-count neighbors. However, again, in principle a clever attacker could evade this test.
