 Last week's Gallup generic ballot declared a 56-38 TGOP lead among likely voters, given average midterm turnout. But that Gallup poll actually shows a 41-28 TGOP lead ... with 31% undecided or unknown.
We can mimic Leonard Suskind's English punter and get stuck on a poll, or we can focus on that 31%.
More below the fold....
Get Out The Vote! (Non-Cynical Saturday)
This week Morning Feature has looked at the storytelling and science of polling. Thursday we explored the history of polling and advances made since the famously wrong "Dewey Defeats Truman" headline in 1948. Yesterday we considered how pollsters try to predict likely voters. Today we conclude by asking what polls can, and can’t, tell us.
We began the discussion Thursday with a humorous anecdote in physicist Leonard Suskind's The Black Hole War. Suskind was having lunch with mathematician Arthur Penrose at an outdoor cafe in England, and the two were watching punters push tourist boats along the river with long poles. One punter's pole got stuck in the muddy river bottom. In trying to pull it free, she pulled herself out of the boat. She was left clinging to the pole as her boat and passengers drifted on. Suskind and Penrose laughed, as did the punter, who was quickly rescued by the next tourist boat.
It's a useful metaphor for elections. The media and we activists can easily get stuck on a poll while events move on, or we let go of the polls and focus on steering the boat.
What 56-38 really means.
Last week's Gallup poll was clearly not good news for Democrats. Like other likely voter polls, it showed a sizable lead for Tea Party Republicans on the generic ballot. As we saw yesterday, Gallup's model is transparent and well-tested over the years. Most other pollsters who publish their likely voter models use a similar threshold-or-out method; only CBS/New York Times counts fractional votes for less-likely voters. Many pollsters keep their likely voter models secret, so we have no way to assess their accuracy except by comparing their final polls to election results.
Gallup uses a 7-question survey, scoring one point for each positive answer unless the respondent says he/she will not vote (automatic 0). Those who score 7 are likely voters. If there aren't enough 7s to match expected turnout, Gallup randomly selects 6s to complete the sample. Hypothetically, if expected turnout were 38%, and 25% of the responses were 7s, and 39% of the responses were 6s, Gallup would count all of the 7s and randomly select one-third of the 6s, thus: 25% (all 7s) + 13% (one-third of 6s) = 38% (expected turnout).
Unlike some likely voter models, Gallup does not weight likely voters by party or by demographics. They do not presume more TGOPers will vote, or that fewer young and minority voters will vote. Indeed they give a slight edge to voters under age 22, as two of their survey questions involve past voting and young voters were not yet eligible. Still, past elections show Gallup's model is about as accurate as any: 73% of those who actually vote were "likely voters" (7s or 6s) by Gallup's method. By comparison, the most rigorous likely voter model I could find - proposed by academics in a journal article - was only slightly more accurate (78%).
But that means 27% of actual voters are not-likely voters. Because Gallup discards the responses of not-likely voters, that 56-38 TGOP lead applies to only 73% of the actual voters. The rest were not counted. Thus Gallup's poll actually shows a 41-29 TGOP lead ... with 31% undecided or unknown.
Reaching "not-likely" voters.
New York Times poll maven Nate Silver agrees that polls are oversold, and he uses a complex mathematical regression analysis both to rate pollsters and to estimate the correlation between polls. (No, I don't understand all of it either.) One measure Silver used to correct polls is campaign spending:
The sum of individual contributions received by each candidate as of the last F.E.C. reporting period (this variable is omitted if one or both candidates are new to the race and have yet to complete an FEC filing period).
We all know that mountains of money are being spent by and for Tea Party Republicans for this election, and that would seem to give them a big edge among the other 31%, the "not-likely" voters. But maybe not. A 2002 Journal of Politics article found that more campaign spending does not always equal more turnout, or more precisely, that each additional $X does not yield an additional Y votes. The curve looks more like this:
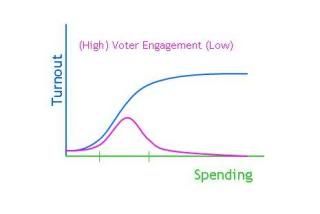 The rising blue line shows voter turnout increasing slowly for a small amount of spending, then rising sharply as the campaign spends more, but then flattening again. The reason is that purple line: voter engagement.
The voters at the left edge of that curve are highly engaged, the kind of people who'll find a candidate in an off-year runoff for dog catcher. It takes very little campaign spending to reach them, but they are the only voters a candidate reaches with only a little campaign spending. To begin reaching the mass of moderately-engaged voters - the bulge in that purple curve - the candidate needs to meet a spending threshold. The candidate's ads, signs, etc. not only reach those who actually see them. They also create "buzz" ... those who see the ads talking about the candidate with other moderately-engaged voters.
But money can only buy so much buzz, or rather, that buzz will only reach so far. Once you get into less-engaged voters more money has little effect. They watch movies or channels that don't run political ads. They ignore political discussions at work or in the neighborhood. But they're about 27% of the actual voters in a typical election.
The "not-likely voters" are most of the unknown 31% in last week's Gallup poll, and that's who your local party, candidates, and OFA want to canvass or call in the next 23 days. The polls are estimates. Money can't buy everything. Midterms come down to turnout, and that comes down to GOTV.
So knock on those doors and make those calls.
+++++
Happy Saturday!
Crossposted from Blogistan Polytechnic Institute (BPICampus.com)
