The South Carolina Democratic primary for U.S. Senate has attracted considerable attention. Here I want to address several particular claims that I've seen made repeatedly here on DKos and elsewhere:
- that surprise winner Alvin Greene didn't do better among black voters;
- that his opponent, Vic Rawl, overwhelmingly won the absentee vote;
- that there were dozens of mathematically impossible results (e.g., more Greene votes than voters).
As far as I can tell, these particular claims are wrong or appear to be wrong. Greene apparently did do substantially better among non-white voters than white voters; Greene appears to have won the absentee vote statewide; there are very few "impossible" results statewide.
Please note: This diary doesn't directly address the accuracy of the electronic count. South Carolina's voting machines provide no software-independent means of verifying the count. One can address whether the results are plausible, but not whether they are correct. So far the results seem plausible to me, but I'm addressing narrower questions here.
This diary assumes some background knowledge and ducks or grazes a lot of issues. I expect to update this diary with further details as time permits.
Data
All my data come from the South Carolina state board of elections at http://www.scvotes.org. Substantial processing is necessary to prepare the data for analysis. I've done some basic sanity-checking, but I certainly can't rule out errors on my part.
Greene and the black vote (or, Rawl and the white vote)
Let me say first of all: it seems likely that most Democratic voters had little idea who either Alvin Greene or Vic Rawl was. So, if black Democrats were more likely to vote for Greene than white voters were, I think it probably had mostly to do with reactions to the names -- but that is speculation. (Update: I took for granted something that I should have made explicit. Saying that "black Democrats were more likely to vote for Greene" is, in this context, no different than saying that "white Democrats were more likely to vote for Rawl." I know of no evidence that white Democrats or black Democrats, Greene voters or Rawl voters were generally more or less informed. It seems likely that most voters regardless of race were voting more or less at random, with [based on past experience] some tendency to favor the candidate listed first. Rawl got a lot of black votes and Greene got a lot of white votes, without which he couldn't have won. Then, of course, there is the question whether the reported counts are accurate at all.)
In my opinion, the issue here isn't whether racial patterns in voting "explain" the Greene victory. Greene won 42 of 46 counties; he didn't do that with black votes alone. But if Greene's vote shares had nothing to do with race or any other measurable variable, well, that would be strange.
At the county level, the correlation between the non-white share of registered voters and Greene's vote share is close to 0. But if we control also for McCain's vote share in 2008, both are moderately strong predictors. Here are the Ordinary Least Squares results. Robust regression using R's default "rlm" settings yields similar results; Weighted Least Squares using votes cast in the Democratic primary yields qualitatively similar results with somewhat larger coefficients. (All three variables here are proportions, between 0 and 1 inclusive.)
Coefficients:
	       Estimate Std. Error t value Pr(>|t|)
(Intercept)	0.02377    0.19415   0.122  0.90314
nonwhite reg	0.58039    0.18049   3.216  0.00247 **
McCain vote	0.73573    0.25428   2.893  0.00596 **

Multiple R-squared: 0.1981,	Adjusted R-squared: 0.1608
At first glance, the significant coefficient for McCain vote share is what we might expect if Republican crossover voting also contributed to Greene's victory. But for various reasons, I don't think that is a solid inference here. One way of interpreting this result is simply that in counties with large McCain vote shares, non-whites tend to comprise a larger share of the
Democratic primary electorate than the raw registration figures imply -- and that, in fact, non-whites were more likely to vote for Greene.
Please note that I didn't say that it is a "fact" that non-whites were more likely to vote for Greene, especially on the basis of this analysis. Any such inference is dubious because these data are at a high level of aggregation (and because they aren't sample data, and for several other reasons). As a sanity check, we should look at precinct-level data. Here is one visualization. (This plot does not take partisanship into account.)
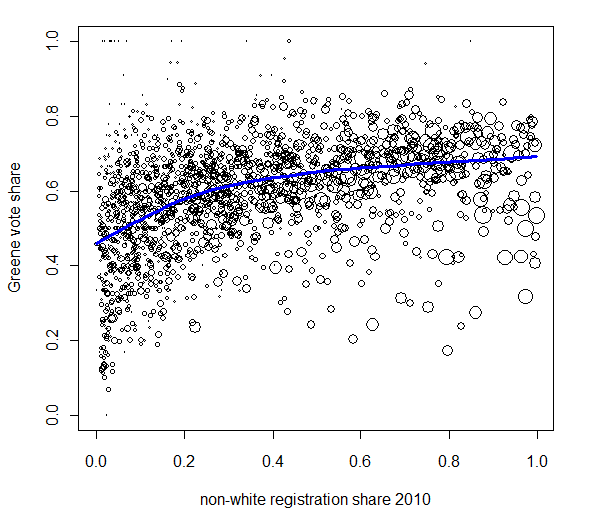
In this chart, the area of each point is proportional to the number of votes cast in the Democratic primary. The blue line is a loess smoother (similar to the ones used on pollster.com and elsewhere). If we treat the precinct data as if they were based on a random sample, the positive relationship between non-white registration share and Greene vote share is statistically robust, even if one weights by votes cast. However, the loess curve indicates that the relationship flattens out as non-white registration share increases. The plot also shows that Greene did poorly in several large precincts with high non-white registration shares; these large precincts tended to be in Orangeburg and Richland Counties. Overall, it appears that a higher proportion of non-white voters did vote for Greene -- although there is no way to tell for sure from aggregate data.
Another (crude) way to look at the question is to consider the "whitest" and "non-whitest" precincts. Among the 227 precincts where at least 95% of registered voters are white, Rawl won 4115 to 2882. Among the 54 precincts where less than 10% of registered voters were white, Greene won 6167 to 3845. (Note that, on average, the latter precincts had a lot more Democratic voters -- no surprise.) Those results can't prove anything about the overall racial composition of the vote, but they provide further reason to suspect that Greene really did do better among non-white than white voters.
A diary on Swing State Project reported the significant relationship between non-white registration and Greene vote share, but went on to say:
But is the relationship there? Hard to say - it is statistically significant, but the R-squared is a measly 0.1425, meaning the other 85.75% of variance in Greene's percentage is explained by something else.
I think that statement is more confusing than helpful. That diary reports a T statistic of over 18, indicating a relationship that is extremely unlikely to be attributable to chance. (That doesn't prove that non-whites were more likely to vote for Greene -- some lurking variable(s) might account for the relationship.) The fact that the relationship doesn't single-handedly predict Greene's vote share doesn't bring into question whether the relationship is "there" at all. (I also don't like the analysis that follows, but I won't go into that here.)
The absentee vote
A Raw Story article asserts, "In 25 precincts, Greene received more votes than were actually cast; and while Rawl won absentee ballots by a whopping 84-to-16 percentage point margin, the election-day results showed Greene winning by 18 percentage points." I'll take the last part of that sentence first. In Lancaster County, Rawl won absentee votes by 84% to 16% (424 to 81), but lost the remainder of votes by 863 to 602. That is indeed a larger than usual differential between absentee and election day votes, although on its own it can't prove much. (Absentee voters aren't just like other voters.)
Overall statewide, according to the figures I downloaded, Greene won the absentee vote by 6761 to 6540. Unquestionably he did much better in the election day vote (almost exclusively cast on touchscreen voting machines) than in the absentee vote -- but he won both. This result provides reason to believe that Greene really did win the election: it is hard to think why Greene would do better in the absentee vote than otherwise.
Impossible vote totals?
The assertion about "25 precincts" apparently refers to an assertion about Spartanburg County made and later withdrawn by Rawl's campaign. I found a total of 16 records where the number of votes reported for Rawl and Greene exceeded the total number of votes reported in the Democratic primary -- but most of them were not at all interesting. Here, let me prove it. :)
Eleven of them were countywide reports for provisional, emergency, or failsafe ballots. In eight of these, the total ballots cast was spuriously reported as 0; in two other cases, it was reported as 1 or 2. The total number of votes reported for Rawl and Greene in these ten "bins" was 35. In the eleventh case, Orangeburg County reported 93 "failsafe provisional" ballots in the Democratic primary, of which 51 were cast for Rawl and 45 for Greene -- a three-vote discrepancy.
In three other cases (from Darlington, Horry, and Marlboro), the number of absentee votes reported is substantially smaller than the total number of votes reported for Rawl and Greene. But when I say "substantially," I mean it only in relative terms. Combined, these three counties reported 1137 votes for Rawl or Greene, and 722 votes cast in the Democratic primary. Those discrepancies should be corrected, but they cast little doubt on the 30,000+ margin in the primary, especially since they don't involve election day votes.
The remaining two discrepancies are in Horry County's Sea Oats #1 precinct, which reported 0 votes cast in the Democratic primary but 26 votes cast for Rawl or Greene; and Marlboro County's Adamsville precinct, which reported 31 votes cast in the primary but 41 votes cast for Rawl or Greene. It's possible that these are the loose ends that would unravel a statewide pattern of error, but it seems unlikely.
Summary
So far, as startling as Greene's victory is, I have seen nothing especially startling about the detailed results. That isn't to vouch for the touchscreen results, much less to argue against close scrutiny of the results and the machines. At least for the moment, any arguments against the machines should be made on the principled basis that the machine results are inherently unverifiable, and not based on questionable assertions about the results in South Carolina. (That isn't to criticize any of the diaries I've read here, which I think generally have been reasonable even when I disagree with them in detail.)
