Economist Dean Baker wants to know, why do we keep sticking it to seniors -- those who can least afford to tighten their belts any further? Good Question.
Time-mark 2:10
Dean Baker: When were talking about an accurate Cost of Living Adjustment, the Bureau of Labor Statistics actually does an "Elderly Index" -- that's supposed to monitor the actual consumption trends of the elderly. It's different from that of the population, as a whole. They consume more health care, less ah ...
Chris Hayes: This is called CPI-E ...
Dean Baker: Dash E -- that's right. And then it actually shows a higher rate of inflation. Everyone will jump on that -- that's just an experimental index. [Then I] always go, "If you're concern is accuracy, have the Bureau of Labor Statistics do a 'Full Elderly Index' -- Let's see what it shows." And they just go running. The point is they want to cut benefits; that's the point here.
Dean Baker: Again were talking about a population that does not have a lot of income for the the most part. And what I find particularly cruel about this, is that these people 'just had their ass kicked' -- they just, you know, their 401Ks are nothing; the equity they had in their homes collapsed (not because of their bad decisions). The folks in Washington could not see an $8 Trillion housing bubble. They were out to lunch. ... So were not talking about taxing Wall Street, were not talking about a Financial Transaction Tax -- were talking about Social Security. What world does that make sense in?
[any errors in transcript are mine.]
link to video
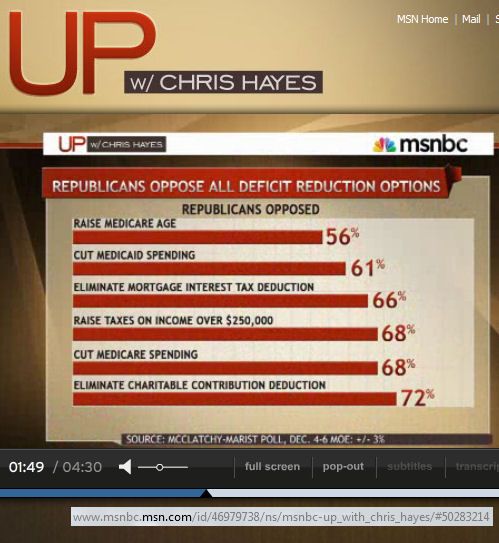
Republicans don't want to Cut our "earned benefits" either:
Chris Hayes has a few keen insights into the recent "fiscal bargaining" with respect to putting our "earned benefits" ... on the table, now.
Time-mark 0:37
Chris Hayes: My feeling on this {Medicare growth rate un-sustainability} is, we just spent all this time, legislative effort, political capital -- on this 2000 page bill, which the Tea Party would keep telling me it's 2000 pages. That means it's bad apparently.
That we passed this big bill, most of which was 'stuff to try to bring down Health Care costs.' Now it might not work. It might be a total disaster. All the critics of the bill's cost-containment measures, might be totally true,
-- BUT let's just see! If it'll work or not, and then come back and re-attack the problem in 5 years.
[any errors in transcript are mine.]
link to video
Here's another interesting chart from an earlier segment in the show:
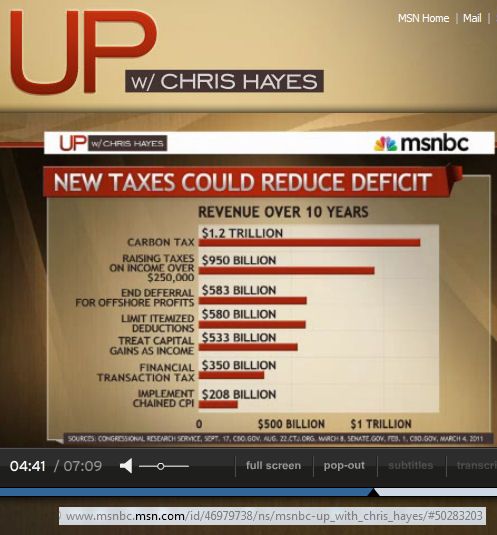
The Chained CPI is projected to only Cut Spending by $208 Billion over next 10 years. Certainly there must be some more fair and humane ways to raise 21 Billion a year? Than playing games with seniors' already too-meager, cost of living increases.
------- -------- ---------
Now about those Dash E numbers, the CPI-E Elderly Index, that Chris and Dean were discussing in the intro of this post. If seniors were treated with the respect, that all their years of hard work (and tax paying) deserves -- they would be getting MORE Benefits, not less.
Last time we checked, the cost of being 'Old in America' is expensive. Inflation is a very BIG deal to them, since most of them live on very fixed incomes.
Bureau of Labor Statistics
Attachment F: Experimental CPI for Americans 62 Years of Age and Older
by Kenneth J. Stewart and Joseph Pavalone
Introduction
The Consumer Price Index (CPI) of the Bureau of Labor Statistics (BLS) measures the average change in prices over time for a fixed marketbasket of goods and services for two population groups. The CPI for All Urban Consumers (CPI-U) represents the spending habits of about 80 percent of the population of the United States. The CPI for Urban Wage Earners and Clerical Workers (CPI-W) is a subset of the CPI-U population, and represents about 32 percent of the total U.S. population.
In addition to the official CPI's for the CPI-U and CPI-W populations, the CPI calculates an experimental price index for Americans 62 years of age or older [CPI-E]. The Older Americans Act of 1987 directed the BLS to develop this experimental index.
[...]
Table 2. Comparative analysis of CPI relative importance data of selected expenditure groups, December 1995.
Expenditure Group CPI-U CPI-W CPI-E
All items 100.00 100.00 100.00
Food and beverages 17.33 19.26 15.00
Food at home 9.88 11.21 9.66
Food away from home 5.89 6.37 4.23
Alcoholic beverages 1.57 1.68 1.10
Housing 41.35 38.89 46.89
Shelter 28.29 25.98 33.88
Apparel and upkeep 5.52 5.53 3.93
Transportation 16.95 19.02 13.82
Medical care 7.36 6.26 12.14
Medical care commodities 1.28 1.06 2.57
Medical care services 6.08 5.21 9.57
Health Insurance .36 .25 1.09
Entertainment 4.37 4.03 3.35
Other goods and services 7.12 7.01 4.87
College tuition 1.61 1.19 0.59
Conclusions
This report analyzed the changes in the prices of three population groups: CPI-U, CPI-W, and the CPI-E, the experimental population of Americans at least 62 years of age, for the period December 1990 through December 1995. Analysis of the relative behavior of the three indexes at the all-items level revealed that the experimental index, which rose 15.9 percent during this period, had a higher rate of increase than the indexes for CPI-U and CPI-W, which rose 14.7 and 14.1 percent, respectively.
The experimental price index, reweighted to incorporate the spending patterns of older consumers, behaved more like the CPI-U than the CPI-W. This was expected, because the CPI-U includes the expenditures of all urban consumers, including those 62 years of age and over. The CPI-W, however, is limited to the spending patterns of wage-earner and clerical families and, therefore, specifically excludes the experience of families whose primary source of income is from retirement pensions.
[...]
Don't our seniors deserve better?
Don't our Wall Street moguls deserve to finally pay their fair share, to the society, from which they continue to extract their extreme 1% wealth?

