This project has been in the works for months. It was spurred on by a conversation that andgarden and I had over Christmas about his belief that a majority of the House of Representatives could be drawn to either be safe or likely for the Democrats. I immediately began to draw maps that satisfied this criteria. The guidelines I set out for myself were thus:
1. First maximize the number of safe seats that can be drawn.
2. Then maximize the number of likely seats that can be drawn.
3. Allow some trade-off between the first two criteria (I.E. two likely seats is better than a safe seat and a winnable Republican seat).
4. Then maximize the number of lean seats that can be drawn.
5. Then maximize the number of tossups that can be drawn.
6. Then maximize the number of winnable seats that can be drawn. These seats are ostensibly Republican, but can be won under the correct circumstances.
7. Fill in the remainder as non-winnable. There were some instances in which I sacrificed a likely or safe district in order to obliterate a non-winnable only because the demographic trends would quickly carry the resultant tossup or lean district back into the likely column.
Obviously the totality of information given varies from state to state and the dividing lines between the categories will also vary from state to state. A 54% Obama seat, for instance, in Mississippi would be safe Democratic while the same level of Obama support would translate to lean Democratic in a state like California. Even within a state the ratings may vary: 56% Obama in far downstate Illinois would lean towards the Democrats, but the same would be a winnable seat in the Chicago suburbs. One other note before I ask you to follow me below the fold to see if I've achieved my goal: the ratings do not take into account incumbents.
This diary has been posted to DK Elections, an official Daily Kos sub-site. Please read the DKE Mission Statement. Our focus is on electoral politics rather than policy or preference. Welcome aboard!
At Large States
2 Safe, 3 Winnable, 2 Non-Winnable
First let's tackle the at-large states. These won't require maps. Obviously there isn't anything we can do to gerrymander these into more favorable territory for the Democrats because, well, they each make up the entire state!
Alaska: Non-Winnable
Delaware: Safe Democratic
Montana: Winnable
North Dakota: Winnable
South Dakota: Winnable
Vermont: Safe Democratic
Wyoming: Non-Winnable
Alabama
2 Safe, 2 Winnable, 3 Non-Winnable
Cumulative: 4 Safe, 5 Winnable, 5 Non-Winnable
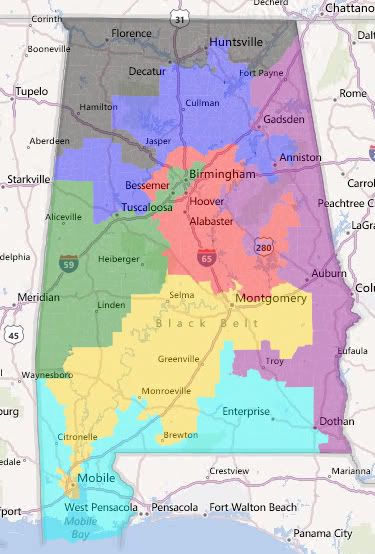
District 1 / Cyan / Jo Bonner (R-Mobile)
Non-Winnable
80.7 White, 13.0 African American
75.5-23.8 McCain
71.5-28.5 Republican
This district used to be based in Mobile, but no longer has a single precinct of that heavily African American city. It is, instead, based in the rest of the Mobile Bay area, Enterprise, and the more Republican parts of Dothan.
District 2 / Gold / Martha Roby (R-Mobile)
Safe Democratic
51.3 African American, 43.8 White
59.6-40.0 Obama
58.2-41.8 Democratic
This district is transformed from a majority white Montgomery based district to a majority African American Montgomery to Mobile district. It takes in Selma and Tuskegee along the way. Although the more African American of the two Voting Rights Act districts I've drawn, it is less Democratic because racial polarization is stronger in these cities than in Birmingham.
District 3 / Purple / Mike Rogers (R-Anniston)
Winnable
68.6 White, 25.8 African American
59.0-40.2 McCain
54.2-45.8 Republican
This district shifts slightly to the north to absorb Democratic leaning Gadsden. This, combined with Anniston and Phenix City, turn the district into one which a southern Democrat like Bobby Bright (although obviously not him) could win in a year favoring the Democrats.
District 4 / Blue / Robert Aderhold (R-Haleyville)
Non-Winnable
89.2 White
77.5-21.4 McCain
67.0-33.0 Republican
This district is used to make the 5th more Democratic: it absorbs Republican leaning parts of Huntsville. Other than that there really isn't much to say except it is still one of the most Republican districts in the country.
District 5 / Black / Mo Brooks (R-Huntsville)
Winnable
75.2 White, 17.5 African American
60.0-40.0 McCain
51.7-48.3 Democratic
This district has, until 2010, been represented by a Democrat with only one brief exception. Taking back the district is going to be difficult, but this configuration would put our best foot forward in pursuit of that goal. Republican parts of Huntsville and Hartselle have been removed in favor of locally Democratic Hamilton and Jasper. Florence and Decatur are maintained as secondary population centers.
District 6 / Red / Spencer Bachus (R-Birmingham)
Non-Winnable
83.6 White, 10.3 African American
78.0-21.2 McCain
75.4-24.6 Republican
This is the most Republican district in the country and is as alabaster as one of its major population bases: Alabaster. The district is basically just white Birmingham suburbs. It gets close enough to Montgomery to also include some of its suburbs (Deatsville, Wetumpka), but not enough for Roby to challenge the recently weak Bachus in a primary.
District 7 / Green / Terri Sewell (D-Birmingham)
Safe Democratic
50.6 African American, 44.7 White
64.0-35.5 Obama
66.7-33.3 Democratic
Terri Sewell is a very well spoken new addition to the CBC and this is her district. Instead of meandering down into Selma and further toward Mobile, the district expands its take of the Birmingham area and focuses more on Tuscaloosa and Demopolis.
Arkansas
1 Safe, 1 Winnable, 2 Non-Winnable
Cumulative: 5 Safe, 6 Winnable, 7 Non-Winnable
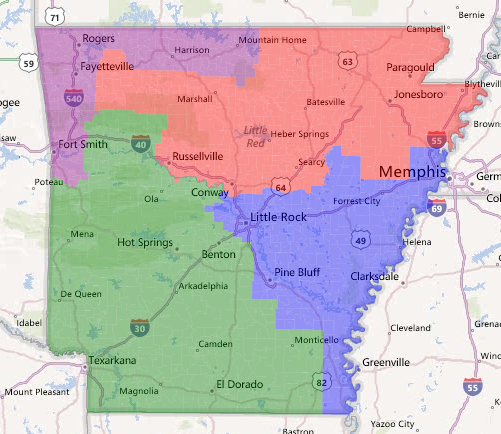
District 1 / Red / Rick Crawford (R-Jonesboro)
Non-Winnable
88.0 White
Dave's App does not have partisan data for Arkansas, so I've been stuck with other sources. This district probably inched up in Republican performance to the low or mid 60s. We aren't taking this district back anytime soon, although if we looked at recent gubernatorial elections you might think we could.
District 2 / Blue / Tim Griffin (R-Little Rock)
Safe Democratic
59.6 White, 34.1 African American
This district will easily be taken back by Democrats if only because of the boost in the African American share of the vote. Obama probably won around 57% of the vote here (he got 55% in Pulaski (Little Rock) and 62% in Jefferson (Pine Bluff) and around 60% in most of the heavily African American counties across the river from Memphis.
District 3 / Purple / Steve Womack (R-Rogers)
Non-Winnable
82.5 White, 9.6 Hispanic
The most Republican district in the state and the one where we weren't able to compete even prior to 2010. Fayetteville and Fort Smith are still the major population bases.
District 4 / Green / Mike Ross (D-Prescott)
Winnable
80.0 White, 13.6 African American
Perhaps I'm being too bullish about our prospects here, but Mike Ross did hang on in 2010. The African American share of the vote was cut by about ten percent, so any Democrat will have to compete a bit harder. If it hadn't been (I should add that it paved the way for a safe seat) this seat coud have possibly been a tossup.
Georgia
3 Safe, 3 Likely, 1 Lean, 1 Tossup, 6 Non-Winnable
Cumulative: 8 Safe, 3 Likely, 1 Lean, 1 Tossup, 6 Winnable, 13 Non-Winnable
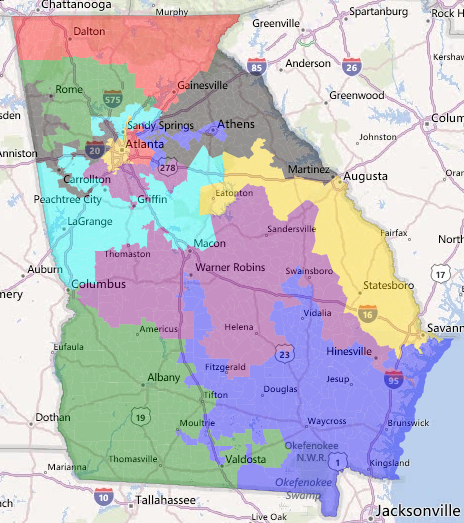
District 1 / Blue / Jack Kingston (R-Savannah)
Non-Winnable
73.1 White, 19.3 African American
68.3-31.0 McCain
63.8-36.2 Republican
This district actually loses areas near Savannah and gains every single heavily Republican precinct in southern Georgia. As a result, no major population bases remain (all of those precincts happen to be heavily rural as well).
District 2 / Green / Sanford Bishop (D-Albany)
Likely Democratic
49.7 White, 43.3 African American
53.7-45.8 Obama
55.4-44.7 Democratic
This district falls beneath majority African American, but I'm not sure that that matters as it is still an opportunity-to-elect district. The current major population bases all remain, but the African American dominant parts of Valdosta are added.
District 3 / Cyan / Lynn Westmoreland (R-Grantville)
Non-Winnable
76.5 White, 17.4 African American
69.5-29.6 McCain
66.8-33.2 Republican
This district is one of the few Republican districts to largely maintain its shape, although Newnan and Carrollton were excised and placed into another district.
District 8 / Purple / Austin Scott (R-Ashburn)
Likely Democratic
51.7 White, 42.0 African American
52.4-47.0 Obama
54.5-45.5 Democratic
This district was given a radical reconfiguration. It is, as a result, substantially more African American. The home base of its incumbent was removed and split between the 1st and the 2nd (giving him nowhere to run). Macon is still the major population base, but Milledgeville, Talbotton, and Oglethorpe were added.
District 9 / Red / Tom Graves (R-Ranger)
Non-Winnable
84.2 White, 10.5 Hispanic
73.3-25.5 McCain
70.1-29.9 Republican
Tom Graves's home base is removed from the district, but I don't think that matters much for his reelection prospects at the district is still radically Republican. On second thought, though, he could lose a primary to a Gainesville politico if someone there really tried.
District 10 / Black / Paul Broun (R-Athens)
Non-Winnable
77.6 White, 12.0 African American
71.1-27.9 McCain
69.1-30.9 Republican
Paul Broun's home base is removed from the district. That's about as interesting an observation I can come up with.
District 12 / Gold / John Barrow (D-Savannah)
Likely Democratic
53.0 White, 39.6 African American
54.7-44.7 Obama
53.9-46.1 Democratic
This district gets a boost in African American share of about five percent to shore up Barrow, who almost lost reelection two years ago. It keeps Savannah and Augusta, but loses Vidalia.
District 14 / Green / No Incumbent
Non-Winnable
83.2 White
72.6-26.0 McCain
71.2-28.8 Republican
This is a new district based in a bunch of small towns of no consequence. Phil Gingrey is actually likely to run here as there is a fair amount of overlap between this and his current district, but he'd do so without the benefit of his home base.
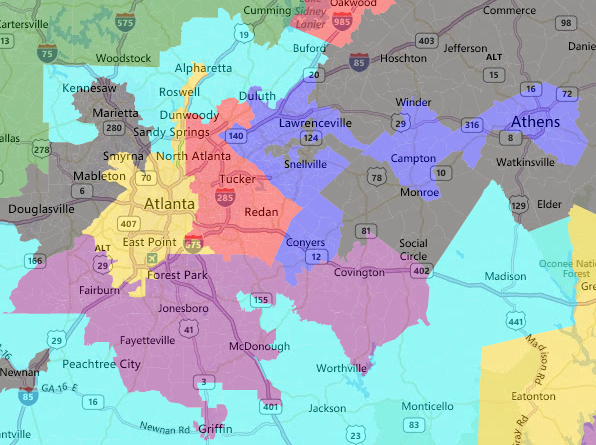
District 4 / Red / Hank Johnson (D-Lithonia)
Safe Democratic
50.3 African American, 32.1 White, 10.0 Hispanic
76.8-22.5 Obama
73.8-26.2 Democratic
This district largely maintains its current area, but sheds alot of its African American population in a successful bid to create third African American majority district.
District 5 / Gold / John Lewis (D-Atlanta)
Safe Democratic
50.1 African American, 37.3 White
76.6-22.5 Obama
74.0-26.0 Obama
This district also largely maintains its current area and sheds alot of its African American population. I also included a lengthy tendril up US 19 to grab pockets of minority and Democratic voters.
District 6 / Cyan / Tom Price (R-Roswell)
Non-Winnable
73.0 White, 9.6 Asian, 9.4 African American
66.8-32.1 McCain
68.9-31.1 Republican
Just like most of the Republican incumbents so far, their home base has been placed within a much more Democratic district, leaving only a shell for them to run in. The rest of the district is actually very similar to the old 6th and is still very very Republican.
District 7 / Blue / Rob Woodall (R-Lawrenceville)
Lean Democratic
44.7 White, 27.1 African American, 17.8 Hispanic, 8.7 Asian
54.6-44.4 Obama
51.8-48.2 Democratic
The total population numbers are actually substantially more minority, so I would be comfortable placing this at the likely end of lean: 39.6 White, 29.1 African American, 20.5 Hispanic, and 8.3 Asian. The district lost Republican areas to tendrils from District 10, and gained Democratic Athens from the same.
District 11 / Black / Phil Gingrey (R-Marietta)
Tossup
54.8 White, 29.3 African American, 11.5 Hispanic
49.6-49.1 Obama
50.4-49.6 Republican
The lone tossup district in the Peach State is probably stable short-term in terms of classification. Increasing minority strength near Atlanta is being counterbalanced by larger and larger losses among the rural whites in the strips used to connect pockets of minority voters (Rome, Carrollton, and Newnan). Long-term, however, the district is trending towards the Democrats because our level of support with whites has to bottom out sometime (even if it that bottom is zero percent).
District 13 / Purple / David Scott (D-Atlanta)
Safe Democratic
51.0 African American, 36.5 White, 7.5 Asian
63.5-35.7 Obama
61.3-38.7 Democratic
The final district in the state is the last African American majority one. Interestingly, although it has the highest African American share, it is the least Democratic of the three. In total, there are six districts which could potentially elect African American politicians. Three of which can solve the "African American politicians are too liberal to run statewide" problem.
Kentucky
3 Likely, 2 Winnable, 1 Non-Winnable
Cumulative: 8 Safe, 6 Likely, 1 Lean, 1 Tossup, 8 Winnable, 14 Non-Winnable
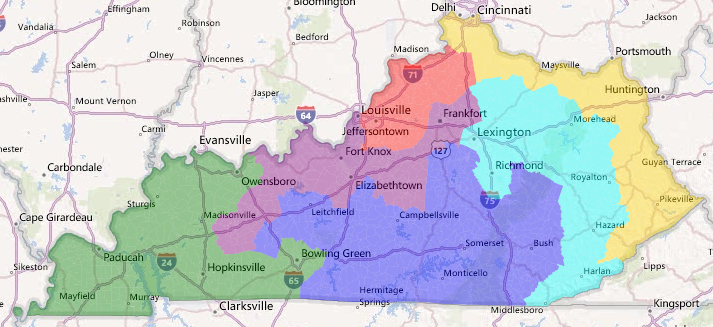
District 1 / Green / Ed Whitfield (R-Hopkinsville)
Winnable
87.9 White, 7.7 African American
In lieu of partisan data, I had to resort to other means to gauge support in the districts. I used this interactive map to see local Democratic support and this one to see federal support. This district definitely supported McCain, but has a better local Democratic base of support because it loses its absurd tendril into Republican central Kentucky.
District 2 / Purple / Brett Guthrie (R-Bowling Green)
Winnable
78.5 White, 15.9 African American
Bowling Green was actually removed from this district and replaced with the heavily African American sections of Louisville and Democratic Frankfort. Guthrie could survive here in neutral years (he typically gets around 68%), but the perhaps 10% increase in Democratic support screws him under bad circumstances (he got 52% in 2008). If he does decide to run in the first, the primary challenge there could result in both of the "winnable" districts falling to us.
District 3 / Red / John Yarmuth (D-Louisville)
Likely Democratic
84.7 White, 8.7 African American
This district is used to drown a few small Republican counties to the northwest of Louisville (so that the 2nd doesn't have to take them). The partisanship of the district doesn't change much, though, so I doubt Yarmuth would have lost even in 2010.
District 4 / Gold / Geoff Davis (R-Hebron)
Likely Democratic
94.5 White
Here we have something radical: I used the coal country to shore up a district we held until the 2004 election. Even then Davis couldn't win but 54% of the vote (51% in 2006). The 10% increase or so in Democratic support screws him even in neutral years.
District 5 / Blue / Hal Rogers (R-Somerset)
Non-Winnable
95.0 White
This district takes in every contiguous county that the Williams/Farmer ticket won in 2011. It could actually be the most Republican district in the country, but I'd have to have reliable partisan data in Dave's App before I would feel comfortable saying for sure one way or the other.
District 6 / Cyan / Ben Chandler (D-Versailles)
Likely Democratic
87.1 White, 7.0 African American
I'm actually not worried about Chandler despite the loss of Frankfort as he absorbs the rest of the coal country (these are actually more Democratic at the local level, I think).
Louisiana
2 Safe, 4 Non-Winnable
Cumulative: 10 Safe, 6 Likely, 1 Lean, 1 Tossup, 8 Winnable, 18 Non-Winnable
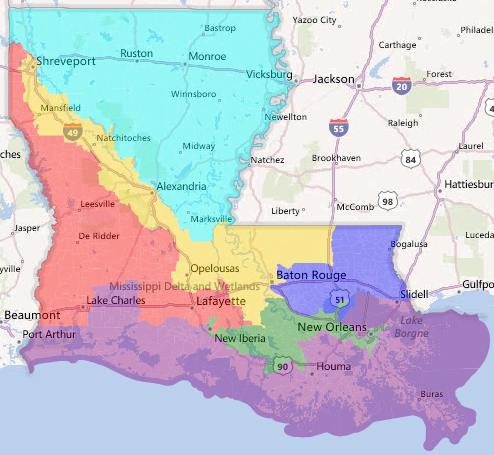
This map is a complete re-work from the previous iteration and was caused by two things: the creating of a second African American majority district and the loss of a seat in apportionment. As a result, I'm going to list the incumbents in the districts they are likely to run in and pay only lip service to the existing lines.
District 1 / Blue / Bill Cassidy (R-Baton Rouge)
Non-Winnable
79.2 White, 14.4 African American
74.8-23.6 McCain
This district loses most of Baton Rouge and shifts to the east, but the population base is still in Cassidy's favor. I'd not be surprised to see a failed primary attempt or two from Hammond.
District 2 / Green / Cedric Richmond (D-New Orleans)
Safe Democratic
50.8 African American, 38.9 White
65.2-33.5 Obama
This district takes in all of heavily African American New Orleans, Thibodaux, and New Iberia. Perhaps I shouldn't rank this district as safe because of Joseph Cao's victory in 2008? I made a funny.
District 3 / Purple / Jeff Landry (R-New Iberia) and Steve Scalise (R-Jefferson)
Non-Winnable
75.8 White, 12.6 African American, 7.0 Hispanic
70.3-27.6 McCain
This district is what Landry wanted except slightly more: a coastal district combined with the white parts of the New Orleans area. Scalise would be heavily favored in the primary.
District 4 / Red / Charles Boustany (R-Lafayette)
Non-Winnable
73.3 White, 20.8 African American
67.0-31.3 McCain
This district is based in Lafayette and all of the rural area to the west and northwest. Lake Charles is also included. It does, however, lose all of the coastline.
District 5 / Cyan / Rodney Alexander (R-Quitman) and John Fleming (R-Minden)
Non-Winnable
67.9 White, 27.8 African American
66.4-32.4 McCain
This district is based in Monroe and the white parts of Shreveport. Given that Alexander represents most of the area while Fleming represents hardly any of it, I'd expect Alexander to win the primary handily. On the other hand, Alexander used to be a Democrat (this might hurt him in the primary) while Fleming was not.
District 6 / Gold / No Incumbent
Safe Democratic
53.2 African American, 41.9 White
60.5-38.4 Obama
Welcome back Cleo Fields! This is much more compact than his previous district, it being a straight line along the Red River taking in Baton Rouge, Alexandria, and Shreveport.
Mississippi
2 Safe, 2 Non-Winnable
Cumulative: 12 Safe, 6 Likely, 1 Lean, 1 Tossup, 8 Winnable, 20 Non-Winnable
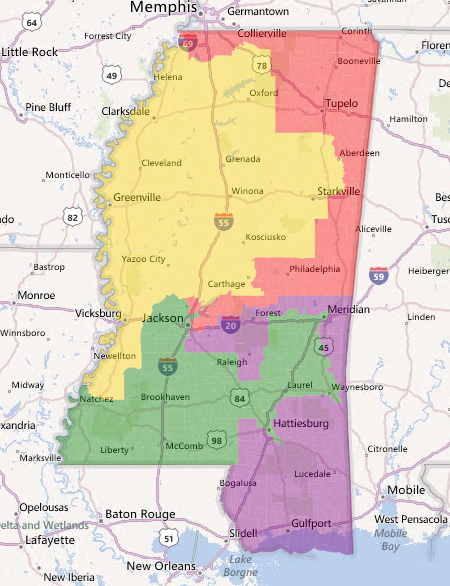
District 1 / Red / Alan Nunnelee (R-Tupelo)
Non-Winnable
75.0 White, 20.2 African American
67.9-31.1 McCain
This district still takes in Southhaven, Tupelo, and Columbus, but loses Grenada and gains Macon and the white environs of Jackson. No Democrat will ever win here.
District 2 / Gold / No Incumbent
Safe Democratic
50.1 African American, 46.5 White
56.9-42.4 Obama
The more northerly of the two African American majority districts focuses on Vicksburg, Carthage, Yazoo City, Greenville, Grenada, Clarksdale, and Starkville. Many of you are probably screaming at me for calling this district safe, but lets get real here: no Republican is ever going to win an African American majority district. Ever. By total population this district is 53.5 African American and 42.9 White, which means this district is going to grow in Democratic performance with time.
District 3 / Green / Bennie Thompson (D-Bolton)
Safe Democratic
50.1 African American, 46.3 White
54.1-45.2 Obama
This is the more southerly of the two African American majority districts and is based in Jackson, Hattiesburg, Natchez, and Meridian. In the same vein as District 2, this district has a growing African American share (53.3-42.9 total population) and really is safe despite the low Obama performance.
District 4 / Purple / Gregg Harper (R-Pearl) and Steven Palazzo (R-Biloxi)
Non-Winnable
76.0 White, 17.7 African American
71.7-27.3 McCain
Some of you are probably wondering why I have this as Non-Winnable instead of Winnable. I know that Gene Taylor held this district with aplomb before 2010 (and only then lost by 5%) and that the African American share, despite the addition of another African American district, didn't fall by much. I say to that this: "ha!" We need to be realistic here. Even if the primary turns nasty between the two Republicans, we aren't going to win this district ever again.
North Carolina
4 Safe, 2 Likely, 1 Lean, 2 Tossup, 4 Non-Winnable
Cumulative: 16 Safe, 8 Likely, 2 Lean, 3 Tossup, 8 Winnable, 24 Non-Winnable
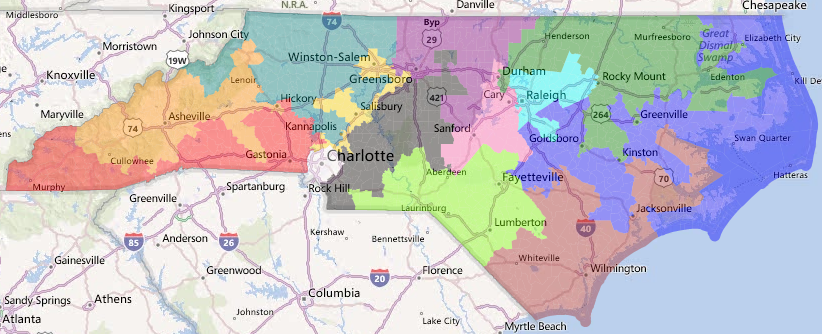
I'm going to go out on a limb and say that within fifteen years North Carolina and Virginia will be safe Democratic states. South Carolina and Georgia may actually be competitive ten years down the line as they're subject to the same demographic trends. Check the comments for an update on North Carolina.
District 1 / Green / G.K. Butterfield (D-Wilson)
Safe Democratic
50.1 African American, 41.7 White
67.5-32.0 Obama
69.2-30.8 Democratic
The only African American majority district in the state is maintained, but in order to do so I had to expand into Durham. The district is actually much visually cleaner than the version from the last decade, but the excursion into Durham harms Democratic chances in other districts.
District 2 / Cyan / Renee Elmers (R-Dunn) and Brad Miller (D-Raleigh)
Likely Democratic
62.8 White, 24.1 African American, 9.0 Hispanic
55.8-43.3 Obama
53.7-46.3 Democratic
This district takes a hit in its African American share, but actually increases its Democratic performance by taking in more of Raleigh. Instead of being R+2 it is probably about D+1 or D+2 (we'd need the 2004 results to know for sure). Miller is definitely favored over Elmers, although she might run against Jones in the 3rd (where she'd be even less likely to win).
District 3 / Blue / Walter Jones (R-Farmville)
Non-Winnable
75.8 White 15.6 African American
63.1-36.1 McCain
59.7-40.3 Republican
This district is the leftovers of the state absorbing every Republican precinct that couldn't be used in any of the surrounding districts. Former Democrat Walter Jones who hails from a Facebook game is safe here just like the little piggies.
District 4 / Pink / David Price (D-Chapel Hill)
Safe Democratic
69.0 White, 14.5 African American, 8.3 Hispanic, 6.5 Asian
57.6-41.4 Obama
54.7-45.3 Democratic
I was actually hesitant to label this district as safe, but after much thought came to the conclusion that no Republican can win a D+5 district in North Carolina. You can blame District 1 for the huge hit in performance this district takes.
District 5 / Teal / Grandma Snake (R-Banner Elk)
Non-Winnable
89.5 White
67.3-31.4 McCain
66.7-33.3 Republican
Grandma Snake Oil is safe here.
District 6 / Black / Howard Coble (R-Greensboro)
Non-Winnable
84.8 White, 7.1 African American
66.6-32.4 McCain
67.9-32.1 Republican
This district is much more extensive than the previous map going down all the way to the South Carolina border and Charlotte suburbs. If Sue Myrick weren't retiring (I've left her off the incumbency section for North Carolina because her district was totally dismantled), she'd run here.
District 7 / Brown / Mike McIntyre (D-Lumberton)
Tossup
71.0 White, 19.7 African American
51.9-47.2 McCain
50.4-49.6 Republican
I tried to make this district as Democratic as possible by exchanging some territory with Kissell's and Farmville's district, but I wasn't able to get a district that Obama won. That isn't any bother though, as it stays at R+5. Any competent southern Democrat can contest an R+5.
District 8 / Chartreuse / Larry Kissell (D-Biscoe)
Safe Democratic
48.6 White, 31.2 African American, 8.7 Native, 7.9 Asian
56.3-43.0 Obama
58.8-41.2 Democratic
On the back of Obama performance alone this would have been a Likely Democratic seat, but Democrats actually usually outperform that in this area. I was surprised that the district was majority minority (I was expecting a mid-50s share).
District 9 / White / Melvin Watt (D-Charlotte)
Safe Democratic
47.4 White, 34.3 African American, 11.9 Hispanic
67.0-32.3 Obama
61.7-38.3 Democratic
The snake-like former 12th was not necessary to promote an African American candidate anymore, so I transformed Sue Myrick's district into a heavily African American Charlotte only district where Watt will be safe and every Democrat after him will be as well.
District 10 / Red / Patrick McHenry (R-Cherryville)
Non-Winnable
85.0 White, 7.9 African American
64.0-34.9 McCain
63.2-36.8 Republican
District 11 / Orange / Heath Shuler (D-Waynesville)
Tossup
86.1 White
49.6-49.1 Obama
50.1-49.9 Republican
In order to make the 11th more Democratic (so that it can truly be called a tossup), I had to use the 10th district to absorb the extremely Republican far reaches of the Appalachians and allow the 11th to take away pockets of Democratic strength in Shelby and Hickory. It also took Boone from Grandma Snake Oil.
District 12 / Gold / No Incumbent
Lean Democratic
62.9 White, 24.5 African American, 8.9 Hispanic
53.8-45.3 Obama
51.4-48.6 Democratic
Although I did create a new African American heavy district based in Charlotte, I kept the snake-like 12th because it was the only way to create another Democratic district. If I had dismantled this we'd be left with two Non-Winnable Republican districts. Winston-Salem is more fully in the district now and it now reaches out to grab Statesville, which was a stranded pocket of Democratic strength in the former map.
District 13 / Purple / No Incumbent
Likely Democratic
63.1 White, 26.6 African American
56.1-43.0 Obama
55.4-44.6 Democratic
Here is a new Democratic district based primarily in Greensboro. There really isn't much else to say about it.
South Carolina
2 Safe, 1 Winnable, 3 Non-Winnable
Cumulative: 18 Safe, 8 Likely, 2 Lean, 3 Tossup, 9 Winnable, 27 Non-Winnable
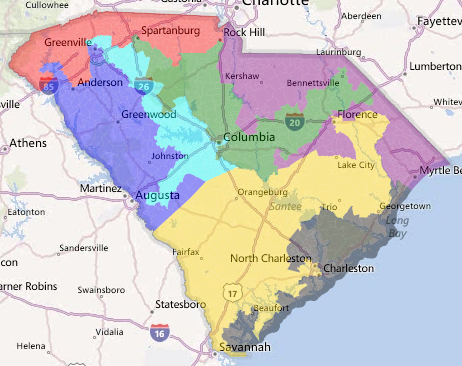
District 1 / Black / Tim Scott (R-Charleston)
Non-Winnable
75.9 White, 15.5 African American
58.0-40.8 McCain
64.5-35.5 Republican
I'm not going to lie: I think it is fantastic that white southerners (to the extent that they're - retirees - culturally southern...) elected a minority representative. This district is probably safe for him for the time being.
District 2 / Cyan / Joe Wilson (R-Columbia)
Non-Winnable
80.9 White, 11.2 African American
67.8-30.8 McCain
70.5-29.5 Republican
You Lie!
District 3 / Blue / Jeff Duncan (R-Laurens)
Winnable
66.0 White, 26.8 African American
54.3-44.4 McCain
57.0-43.0 Republican
I bet my bottom dollar that a competent Democrat could win this district. I'm actually surprised that I could draw a district as favorable to Democrats as this in the westerly half of the state (the more Republican half).
District 4 / Red / Trey Gowdy (R-Spartanburg)
Non-Winnable
83.4 White, 11.0 African American
68.1-30.3 McCain
71.1-28.9 Republican
Trey Gowdy is my favorite Republican. He's principled. He's smart. He's well spoken. He's attractive. He's young (relatively). He went to Baylor (not my favorite school, but in Texas!). Most of all, though, he is a good advocate for federalism and he doesn't just talk that talk; he walks the walk. Have you heard him talk about D.C. self-determinism? Simply amazing.
District 5 / Purple / Mike Mulvaney (R-Lancaster)
Non-Winnable
73.6 White, 19.8 African American
59.8-39.1 McCain
64.0-36.0 Republican
I won't be holding my breath for someone in the mold of John Spratt to come riding on a white horse to our rescue. It would be a miscue for us to think that that'll happen.
District 6 / Gold / No Incumbent
Safe Democratic
50.2 African American, 44.0 White
62.9-36.0 Obama
60.6-39.4 Republican
An additional African American majority district in South Carolina! This district, facially, looks more similar to the current majority district, so you'd expect Clyburn to run here. He, however, lives in Columbia not Charleston.
District 7 / Green / Jim Clyburn (D-Columbia)
Safe Democratic
50.1 African American, 42.9 White
66.3-32.8 Obama
64.6-35.4 Democratic
Who among us was not angry when the honorable (?) Jim Clyburn came out against a second African American majority district? Who among us was not livid at the many African American congresspeople who have been against expansion of minority power? Maybe someone from Spartanburg will primary his ass.
Tennessee
1 Safe, 1 Likely, 2 Tossup, 5 Non-Winnable
Cumulative: 19 Safe, 9 Likely, 2 Lean, 5 Tossup, 9 Winnable, 32 Non-Winnable
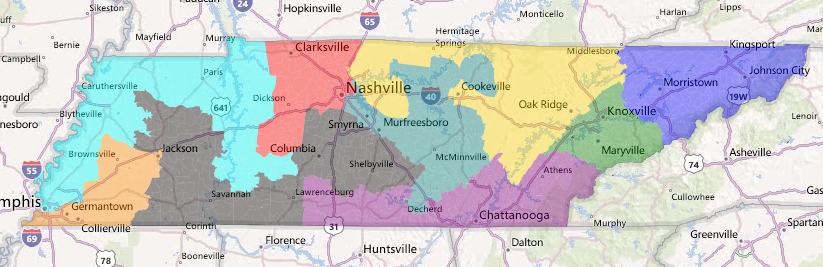
District 1 / Blue / Phil Roe (R-Johnson City)
Non-Winnable
94.0 White
70.9-29.1 McCain
63.9-36.1 Republican
District 2 / Green / John Duncan, Jr. (R-Knoxville)
Non-Winnable
88.6 White
65.5-34.5 McCain
59.2-40.8 Republican
District 3 / Purple / Chuck Fleischmann (R-Chattanooga) and Scott DesJarlais (R-South Pittsburg)
Non-Winnable
83.4 White, 11.1 African American
67.4-32.6 McCain
59.6-40.4 Republican
Based in the Tri-Cities area, Knoxville, and Chattanooga, respectively, like always and some of the most Republican districts in the country (and in a good way if you know the history).
District 4 / Teal / No Incumbent
Tossup
75.0 White, 13.2 African American
53.1-46.9 McCain
50.8-49.2 Democratic
This district keeps its hold on some locally Republican small cities like McMinnville and Murfreesboro, but also extends into Democratic white parts of Nashville in order to transform the district from "Winnable" to legitimately "Tossup", although perhaps on the more Republican side of Tossup.
District 5 / Red / Jim Cooper (D-Nashville)
Likely Democratic
71.9 White, 19.9 African American
53.5-46.5 Obama
56.8-43.2 Democratic
This is on the inside edge of Likely, but still there nonetheless. Any district where Obama could pull a majority in the south is either Likely or Safe, the differentiating factor between the two being the demographic makeup. Those that are 40+ African American are safe while those that are 30-40 are likely.
District 6 / Gold / Diane Black (R-Gallatin)
Non-Winnable
92.5 White
68.0-32.0 McCain
59.6-40.4 Republican
Diane Black's district is forced to absorb alot of ancestrally Democratic territory (notice the large difference between local and federal elections), but that doesn't push her district into scary territory. Still safely Republican.
District 7 / Black / Marsha Blackburn (R-Brentwood)
Non-Winnable
87.4 White, 7.2 African American
68.1-31.9 McCain
61.0-39.0 Republican
Marsha Blackburn is almost as bad as Grandma Snake Oil, but not quite there yet. Perhaps a much more Republican district will force her to posture even further to the right?
District 8 / Cyan / Stephen Fincher (R-Crockett)
Tossup
66.2 White, 28.0 African American
50.9-49.1 McCain
52.0-48.0 Democratic
This district took in as many African American precincts in Memphis as possible and then curved around to take in the ancestrally Democratic Tennessee River Valley. Any competent southern Democrat can take and hold this.
District 9 / Orange / Steve Cohen (D-Memphis)
Safe Democratic
50.8 African American, 41.8 White
63.6-36.4 Obama
58.8-41.2 Democratic
It's a small wonder that Cohen can hold this district primary after primary. Taking down the African American share will help him in this regard, but the district should still be considered one where African Americans have an opportunity to elect.
Virginia
3 Safe, 2 Likely, 1 Lean, 2 Tossup, 1 Winnable, 2 Non-Winnable
Cumulative: 22 Safe, 11 Likely, 3 Lean, 7 Tossup, 10 Winnable, 34 Non-Winnable
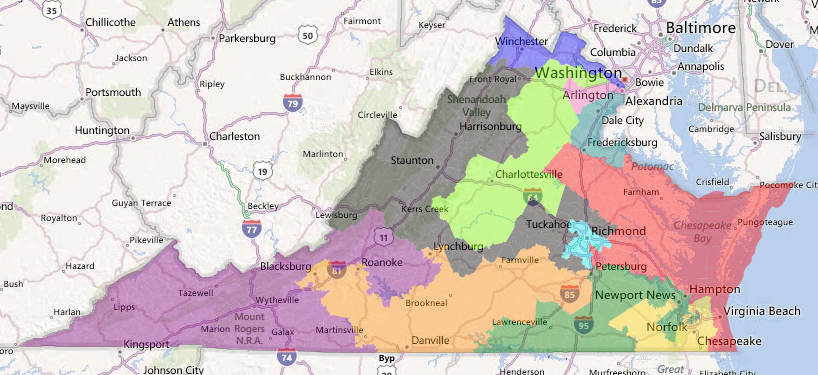
District 1 / Teal / No Incumbent
Likely Democratic
55.1 White, 18.6 African American, 15.2 Hispanic, 8.5 Asian
57.6-42.4 Obama
53.1-46.9 Democratic
This district got a radical makeover on account of massive NoVa growth. It contracts into the D.C. metro area and is, as a result, a Democratic stronghold just outside of being safe.
District 2 / Red / Rob Whitman (R-Montross) and Scott Rigell (R-Virginia Beach)
Winnable
74.2 White, 17.5 African American
55.2-44.8 McCain
56.8-43.2 Republican
This district is basically a combination of both incumbents' districts. Scott Rigell would definitely be favored in the primary, which is a shame as he's the more moderate of the two (whatever that means as the only moderate thing he's ever done was donate to Obama). The Democrats' opening would be if the primary descended into a bloodbath.
District 3 / Green / Bobby Scott (D-Newport News)
Safe Democratic
50.1 African American, 41.7 White
67.4-32.6 Obama
62.0-38.0 Democratic
This district is much less Democratic than before because Richmond and her African American population were removed.
District 4 / Gold / Randy Forbes (R-Chesapeake)
Tossup
63.6 White, 23.7 African American
50.6-49.4 Obama
51.6-48.4 Republican
This district contract into the Chesapeake area, but now takes in some extra minority precincts from Norfolk. I actually think the Republicans would win this district more often than not, but that doesn't mean it isn't a legitimate tossup.
District 5 / Orange / Robert Hurt (R-Chatham) and Bob Goodlatte (R-Roanoke)
Tossup
71.7 White, 22.8 African American
50.7-49.3 McCain
52.4-47.6 Republican
I made this district as Democratic as possible. It snakes into every single city with a substantial number of Democrats, but these are still outweighed by the rural and suburban white conservatives. Roanoke, Radford, Salem, Lynchburg, Danville, and Martinsville all contribute to a Democrat's chances here.
District 6 / Black / Eric Cantor (R-Richmond)
Non-Winnable
87.1 White, 7.5 African American
63.3-36.7 McCain
64.4-35.6 Republican
Eric Cantor's district is perennially not targeted by our side despite being something winnable. Screw that. I'd rather have him in the Republican leadership so that he can continue making a fool of his party. Oh, and he's hot. I've always gotten the feeling he's in the closet, so if there's the possibility that a scandal is down the road I'd rather have him still entangled with power for maximum effect. Now his seat is safe in the general, but not necessarily the primary.
District 7 / Cyan / No Incumbent
Safe Democratic
56.3 White, 31.7 African American
59.9-40.1 Obama
53.6-46.4 Democratic
Obama's performance is more realistic here for a Democratic going forward. I actually think an African American would take this seat.
District 8 / Chartreuse / Frank Wolf (R-Vienna)
Lean Democratic
70.1 White, 11.0 Asian, 10.2 African American
54.8-45.2 Obama
51.5-48.5 Democratic
I should remind everyone at this point that incumbents have no bearing on my rankings. Frank Wolf could hold this district with ease, but that doesn't mean its a Winnable district. It definitely is a Lean Democratic seat.
District 9 / Purple / Morgan Griffith (R-Salem)
Non-Winnable
92.9 White
65.3-34.7 McCain
61.0-39.0 Republican
Although held by a Democrat for freaking ever before 2010, that was with the aid of a bunch of small cities that are now in District 5. Now the district is crazily Republican and certainly not somewhere where we can compete.
District 10 / Blue / Jim Moran (D-Arlington)
Likely Democratic
69.2 White, 11.9 Hispanic, 10.2 Asian
56.8-43.2 Obama
54.6-45.4 Democratic
The purpose of the the expansion up to the West Virginia border was to coax Frank Wolk into retirement: his district's population is actually mostly here, but a run against another incumbent wouldn't be palatable. If he did, then District 8 would easily fall out of Republican hands.
District 11 / Pink / Gerry Connolly (D-Fairfax)
Safe Democratic
55.6 White, 17.2 Hispanic, 14.1 Asian, 10.8 African American
59.0-41.0 Obama
55.3-44.7 Democratic
Interesting that Connolly gets the safe seat now and Moran gets the likely one. I could easily bring the performance of District 3 up a bit by trading a few precincts so that each is about 58.3 Obama, but the look of the border is very smooth as it is and you all know I like visually appealing maps.
West Virginia
1 Tossup, 1 Winnable, 1 Non-Winnable
Cumulative: 22 Safe, 11 Likely, 3 Lean, 8 Tossup, 11 Winnable, 35 Non-Winnable
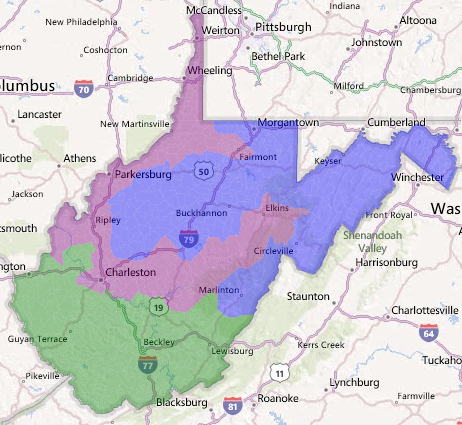
West Virginia does not have partisan data input yet into Dave's Application, so I'm stuck on using other sources. Unfortunately, Presidential data from any election in the past 15 years is completely useless in determining Democratic strength in this state. In lieu of that I had to find an election which showed where Republican strength lies in a "competitive" election. I settled on the 2011 gubernatorial special election and used the same method I did in Kentucky: pack every red county into as few districts as possible. Even still, without local partisan data I have to rank the seats as cautiously as possible. The first district (blue) is Non-Winnable. The second district (green) is tossup. The third district (purple) is Winnable, as it takes in some large counties that Maloney won.
Recap
Pennsylvania
7 Safe, 3 Likely, 3 Tossup, 5 Non-Winnable
New York
15 Safe, 5 Likely, 2 Lean, 3 Tossup, 1 Winnable, 1 Non-Winnable
At Large and The South
See comments for changes to Georgia, North Carolina, and Virginia
26 Safe, 7 Likely, 2 Lean, 9 Tossup, 11 Winnable, 35 Non-Winnable
Total
48 Safe, 15 Likely, 4 Lean, 15 Tossup, 12 Winnable, 41 Non-Winnable
