Recently, the Pennsylvania Supreme Court ruled that the Republican-drawn maps of Pennsylvania’s legislative districts could be used for the 2014 elections. When I took a look at these maps, I was struck by how tame and ungerrymandered-looking they were, especially compared to Republican maps in other states (such as North Carolina). I was therefore curious at what Pennsylvania Republicans could have done if they chose to go all out in their gerrymandering like many other states did. It turns out that they could have gone a lot further in creating districts that were safe for them, and defeating Democratic incumbents. Thus, as a thought exercise in fantasy redistricting, I drew up a set of maps that are devastating Republican gerrymanders. I drew maps of Pennsylvania’s Congressional districts and legislative districts for both the State Senate and the State House of Representatives. We Democrats should thank our lucky stars that these maps weren’t implemented, because if they were, Democrats would basically have no chance whatsoever of coming even close to taking back one or both of the chambers of the Pennsylvania Legislature. My Congressional maps are also more severe than the current map (and yes, that is possible).
So follow me over the fold to take a look at what we are all glad did not happen!
This diary has been posted to DK Elections, an official Daily Kos sub-site. Please read the DKE Mission Statement. Our focus is on electoral politics rather than policy or preference. Welcome aboard!
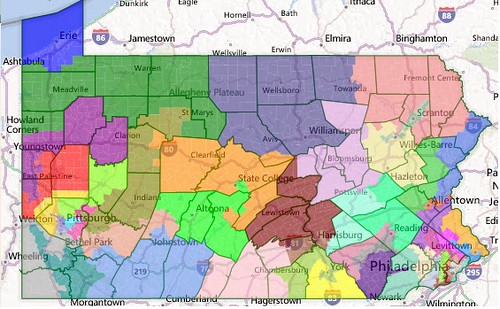
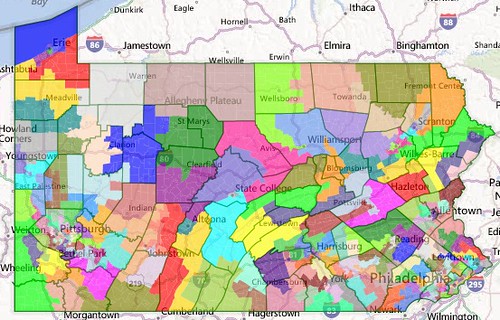
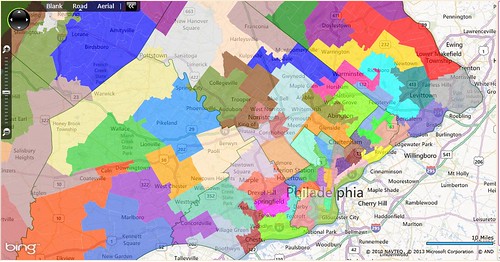
Congressional Districts: And You Thought 13-5 Was Bad?
Here is a map of the whole state:
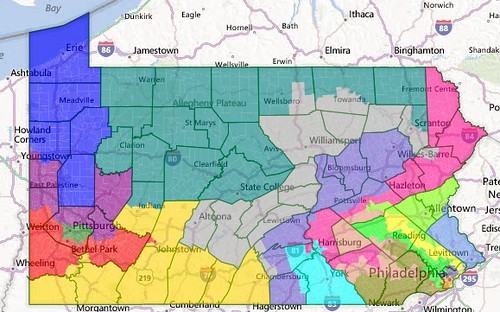
District 1: Mike Kelly (R-Butler)
Demographics: 94/3/2/1 (White/Black/Hispanic/Asian, all in VAP)
Prez 2008: 51-47 McCain
This district is improved for Kelly by including all of Butler County, which neatly drowns out Erie County. It also includes all of Crawford and Venango Counties, most of Mercer County, and a small part of Lawrence. SAFE R.
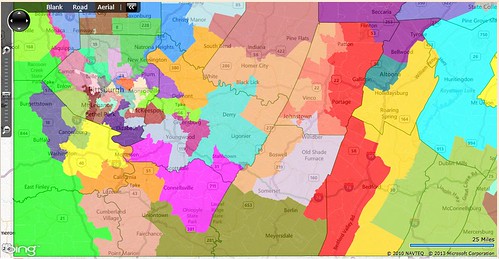
Southwest Pennsylvania:
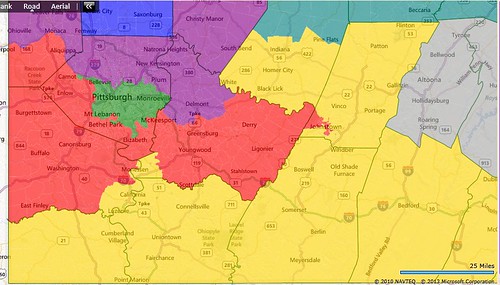
District 2: Mike Doyle (D-Pittsburgh)
Demographics: 75/19/2/3
Prez 2008: 67-32 Obama
This district takes in all of Pittsburgh and most of its more Democratic inner suburbs. It’s quite similar to Doyle’s current district. This is one of the few Democratic districts in my map. SAFE D.
District 3: Keith Rothfus (R-Sewickley)
Demographics: 94/3/1/1
Prez 2008: 55-45 McCain
This district includes parts of Lawrence and Beaver Counties, the northern suburbs of Pittsburgh, NW Westmoreland County, and all of Armstrong County. Jason Altmire lives here, and could be a strong candidate for the Democrats, however this district is trending away from us, and it would be hard to dislodge an incumbent here. LEAN R with Altmire, SAFE R without Altmire
District 4: Tim Murphy (R-Upper St. Clair)
Demographics: 95/3/1/1
Prez 2008: 55-44 McCain
This district takes in the southern parts of Beaver and Allegheny Counties, and most of Washington and Westmoreland Counties, and then dips a finger into Cambria County to pick up Johnstown. This district is trending away from us, and Tim Murphy is a popular, entrenched incumbent. SAFE R.
District 5: Bill Shuster (R-Hollidaysburg)
Demographics: 94/3/1/1
Prez 2008: 56-43 McCain
This district takes in all of Greene, Fayette, Somerset, Bedford, Fulton, and Franklin Counties, as well as most of Cambria and parts of Washington, Westmoreland, and Indiana. This is actually the most Republican district in the state, which goes to show just how well I have gerrymandered the state. Shuster doesn’t actually live in this district (he lives in Blair County), but he would run here. The additions of Bedford, Fulton, and Franklin Counties to this district, which otherwise is similar to John Murtha’s old district, make it totally unwinnable for us. SAFE R.
District 6: Glenn “G.T.” Thompson (R-Bellefonte)
Demographics: 94/2/2/2
Prez 2008: 52-47 McCain
This district takes in vast, mostly rural section of northern and central Pennsylvania. It then stretches an arm out to Lackawanna County to pick up some Democrats there, with the goal of eliminating Matt Cartwright. Despite this, Thompson is a popular incumbent and can win Dem-leaning Centre County, so he is safe. SAFE R.
District 7: Tom Marino (R-Williamsport) and Matt Cartwright (D-Moosic)
Demographics: 92/3/3/1
Prez 2008: 54-45 McCain
This district slashes through the center of the state in an effort to crack Lackawanna County. It stretches from Scranton to Altoona, with lots of rural Republican areas in between. Marino may not be particularly well liked, but he doesn’t have to be, since Cartwright has no chance of winning here. SAFE R.
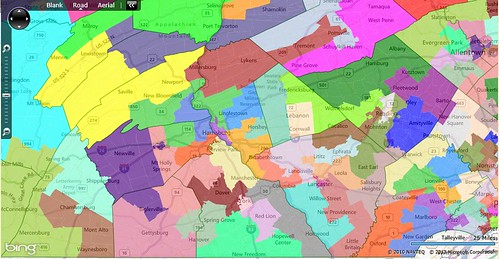
South-central Pennsylvania:
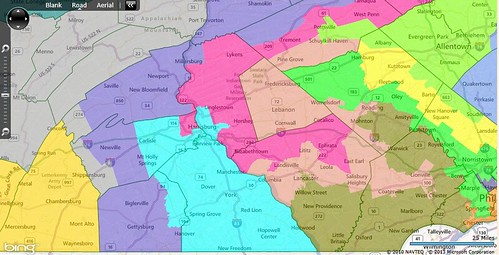
District 8: Lou Barletta (R-Hazleton)
Demographics: 93/2/4/1
Prez 2008: 52-47 McCain
This district also slashes through the center of the state, but its center of gravity is more to the north, where it takes in all of Luzerne County. It then goes all the way to the Maryland border where it takes in Adams County and Gettysburg. This district’s only blue area is Wilkes-Barre, and Barletta can do well there since he is from Luzerne County. SAFE R.
As a side note, this district also takes in part of Schuylkill County. When I drew this map, one of my first considerations was to ensure that a Tim Holden comeback does not happen. To this end, I split Schuylkill County into not two, not three, but FOUR pieces, each with a large chunk of the county’s voters. Holden has nowhere to run under this map.
District 9: Scott Perry (R-Carroll Township)
Demographics: 84/9/5/2
Prez 2008: 52-47 McCain
This district is quite similar to Perry’s current district. It contains all of York County, the city of Harrisburg, some suburbs in Cumberland County, and a small slice of Adams County. Perry is completely safe here, as Obama outperformed most Democrats in York County in 2008. SAFE R.
District 10: Open Seat
Demographics: 88/4/4/2
Prez 2008: 54-45 McCain
This district is the open seat that results from the dismantling of Matt Cartwright’s district. It begins in Wayne County, takes in Pike, Monroe, and Carbon, slices through Schuylkill, includes the Republican parts of Dauphin County, takes in a small slice of Cumberland County, and then finishes with heavily Republican northern Lancaster County. I’m not quite sure who would run here, but the winner of the election would definitely be a Republican. SAFE R.
Southeast Pennsylvania:
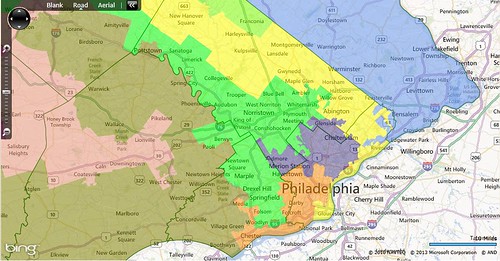
District 11: Charlie Dent (R-Allentown)
Demographics: 82/4/11/2
Prez 2008: 55-44 Obama
This district is similar to Dent’s current district. It includes all of Lehigh, most of Northampton except for Easton, a slice of Schuylkill including Pottsville, and an arm into Montgomery that includes heavily Republican Franconia Township. Seeing as Dent survived the 2006 and 2008 waves with little difficulty, I don’t see him losing this district. Tim Holden actually lives here, but he is unknown in the Lehigh Valley, so Dent would probably beat him. LEAN R with Holden, LIKELY R otherwise
District 12: Mike Fitzpatrick (R-Levittown)
Demographics: 88/4/4/4
Prez 2008: 54-45 Obama
This district includes all of Bucks County, Easton, and parts of Northeast Philadelphia. Fitzpatrick is a popular incumbent who ran six points ahead of Romney last year, so he should be mostly safe. However, since the district is probably an Obama district with the addition of Easton, I think it’s LIKELY R.
District 13: Jim Gerlach (R-West Pikeland Township)
Demographics: 82/5/10/2
Prez 2008: 50-49 Obama
This district weaves its way around eastern and southeastern Pennsylvania, taking in the fourth slice of Schuylkill County as well as Lebanon County and parts of Berks, Lancaster, and Chester. Romney won this district last year, Democrats generally do worse here downballot, and Jim Gerlach is a strong incumbent, so this district is SAFE R.
District 14: Joe Pitts (R-Kennett Square)
Demographics: 85/5/7/3
Prez 2008: 52-47 Obama
This district takes in mostly Republican areas of Lancaster, Chester, Delaware, and Berks Counties, as well as Pottstown in Montgomery County. This district, even more than the 13th, is heavily Republican downballot, and even though Pitts is a right-winger and Obama won here in 2008, Romney won here in 2012, and we have no bench here. Pitts is safe. SAFE R.
District 15: Chaka Fattah (D-Philadelphia)
Demographics: 33/52/5/8
Prez 2008: 90-10 Obama
Although Bob Brady currently represents a substantial chunk of this district, I think Fattah would run here because this district is majority-African-American while the other Democratic district in Philadelphia is not. Either way, this is completely safe for any Democrat. SAFE D.
District 16: Pat Meehan (R-Drexel Hill)
Demographics: 84/6/4/5
Prez 2008: 56-43 Obama
This district stretches from central Delaware County to outer Berks County, with a substantial chunk of Montgomery in between. Obama performed significantly worse here in 2012 than in 2008, and Pat Meehan is a strong incumbent (he outperformed Romney by about seven points last year). Meehan could probably hold this district down in a neutral year, but he would be vulnerable in a wave year. LEAN R.
District 17: Bob Brady (D-Philadelphia)
Demographics: 32/44/17/6
Prez 2008: 88-12 Obama
This district is the other Democratic district in Philadelphia. It takes in part of North and Northeast Philly, as well as most of Lower Merion and Cheltenham Townships. Brady is safe here, but if he retires this district would be a prime opportunity for an African-American. SAFE D.
District 18: Open Seat
Demographics: 82/7/4/6
Prez 2008: 56-43 Obama
This is the riskiest district I drew. It stretches from South Philly all the way to Berks County, and is politically divided between its north and south segments. Republicans would need a strong candidate to win and hold this seat, but luckily for them they have many in the State Legislature, including State Representative Tom Murt (R-Upper Moreland Township). Democrats would probably have to run a Montco-based candidate if they wanted to win here. How this district will vote depends on the candidates, but just based on the map I’d say it is a TOSSUP.
So there we go. This map would create 14 Republican districts, one Tossup district, and only three Democratic districts in the entire state. We should all feel lucky that Republicans didn’t draw this map.
But wait, there’s more…
State Senate
I’m not going to talk about each individual district here like I did with the Congressional districts, but I’ll talk about each region of the state.
Southwest Pennsylvania:
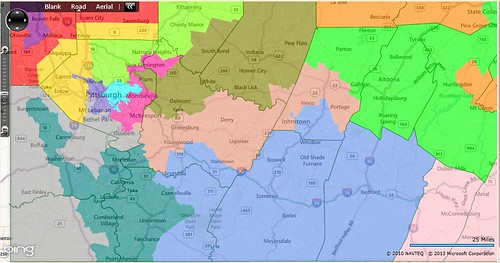
First, freshman State Senator Sean Wiley (D) keeps his Erie-based seat. It wasn't worth trying to dismantle this one. However, this map is less merciful with other Democratic State Senators. Matt Smith (D-Mount Lebanon Township) was combined with another Democratic State Senator, and a second Pittsburgh Democrat was drawn out of their seat as well. In addition, State Senators Rich Kasunic (D-Dunbar) and Tim Solobay (D-Canonsburg) have been combined in a Democratic vote sink, while the district of John Wozniak (D-Johnstown) has been split into several pieces, each of which is far too Republican for Wozniak to win in.
South-central Pennsylvania:
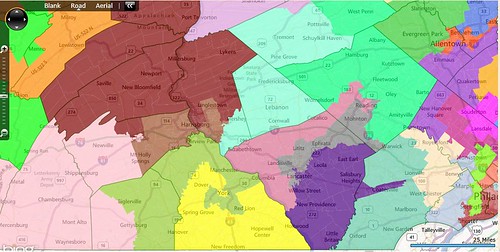
Moving on to central Pennsylvania, Rob Teplitz (D-Susquehanna Township) has been placed in an unwinnable district, while all the other districts remain heavily Republican. The two Democratic districts in NEPA have been combined into one, and I also created a Democratic vote sink in the Lehigh Valley to ensure that all the surrounding districts are Republican. I also eliminated Sen. Judy Schwank (D-Fleetwood) by splitting her district into three pieces: Reading goes with northern Lancaster, Reading’s suburbs go with Lancaster’s suburbs, and a new, all-rural Berks County district is created.
Southeast Pennsylvania:
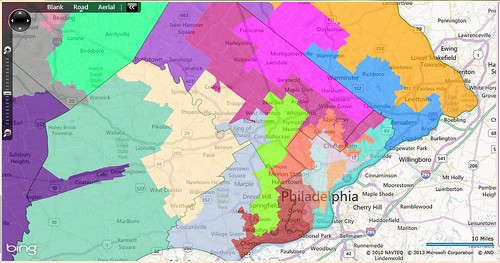
In SEPA, drawing the districts was more about keeping the current incumbents safe, since SEPA is already pretty gerrymandered. I maintained the Bucks County gerrymander, took Chester out of Dominic Pileggi (R)’s district to make him safer, and split the district of Andy Dinniman (D-West Whiteland Township) into three pieces, each of which is pretty Republican. I also created a swing district entirely in the city of Philadelphia.
So in total, this map has:
12 Safe D
1 Tossup
37 Lean, Likely, and Safe R
With this map, we’d be lucky if we got more than 15 Democrats in the State Senate, never mind a majority.
Is a gerrymander like this possible in the State House of Representatives as well? Yes, it is.
State House of Representatives
This section is going to be more maps than descriptions, since there are way too many districts (203) to go through.
Southwest Pennsylvania:
In general, I tried to combine Democratic areas into just one or two districts, and spread the moderate surrounding areas with conservative rural areas.
South-central Pennsylvania:
Other times, I went after particular incumbents, for example Rick Mirabito in Lycoming County. He’s a Democrat that represents a very Republican district. To get rid of him, I put his hometown of Williamsport in with heavily Republican Tioga County, because the voters there who don’t know him won’t vote for him.
Northeast Pennsylvania:
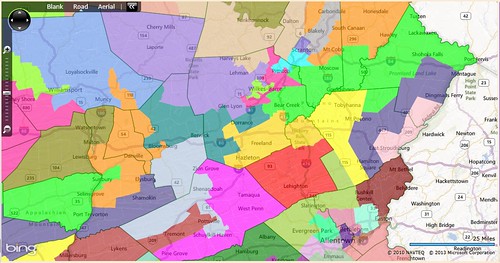
There are more swing districts in this map than in my other two maps. This was unavoidable; large areas of Pennsylvania are swingy, and sometimes, the districts just get too small to gerrymander.
Southeast Pennsylvania:
Many Republicans in SEPA represent districts that voted strongly for Obama in 2008, especially in Delaware County. I tried to protect these incumbents without sacrificing too many seats.
In a neutral year, Democrats would probably win around 65 of the 203 seats in the Pennsylvania House of Representatives with this map. We currently have 93 seats, so that's a very big drop.
It just goes to show that the Pennsylvania Republicans could have been a heck of a lot more ruthless with redistricting than they actually were, and we should definitely be thankful for that.
Questions, comments, concerns, and thoughts are all appreciated.

