Two new papers on our rapidly changing climate deserve our attention. Sadly, as environmental journalism dies, few outside the scientific community are likely to be aware of the findings.
The first reality test comes from the pages of the journal Science. Researchers from Oregon State and Harvard examined sediment cores from 73 sites across the globe to reconstruct regional and global temperatures over the past 11,300 years. That spans the entire period since the last ice age. It also encompasses human civilization, our explosive growth in population and technology.
What we already know about the trend in global temperatures is that the levels and trajectory are unprecedented in the past 2000 years, a conclusion based largely on surface temperature reconstructions. The medieval period of warmth that "skeptics" slobber about was a regional anomaly. Going further back in time gives us even better perspective about how much our climate is changing and how fast.
Here is the summary of the findings from the Science paper by Shaun Marcott and colleagues from Oregon State and Harvard. The number to remember is 75%.
Surface temperature reconstructions of the past 1500 years suggest that recent warming is unprecedented in that time. Here we provide a broader perspective by reconstructing regional and global temperature anomalies for the past 11,300 years from 73 globally distributed records. Early Holocene (10,000 to 5000 years ago) warmth is followed by ~0.7°C cooling through the middle to late Holocene (<5000 years ago), culminating in the coolest temperatures of the Holocene during the Little Ice Age, about 200 years ago. This cooling is largely associated with ~2°C change in the North Atlantic. Current global temperatures of the past decade have not yet exceeded peak interglacial values but are warmer than during ~75% of the Holocene temperature history (emphasis added). Intergovernmental Panel on Climate Change model projections for 2100 exceed the full distribution of Holocene temperature under all plausible greenhouse gas emission scenarios.
Science (8 March 2013): Vol. 339, pp. 1198-1201
The good news is that we have not exceeded the highest temperatures recorded during the interglacial period. The bad news is that current global temperatures exceed about 75% of temperatures since the previous ice age. The worse news is that every emissions scenario in climate models pushes us over the interglacial record during the 21st century. In other words, even
if we wake up and drastically slow fossil fueled climate change, we will still face the warmest planet since the ascendance of our species after the last ice age, along with the highest levels of ocean acidification, sea levels, and a bevy of other nasty consequences of deliberately destabilizing the atmosphere.
The study shows that over the past 5,000 years, global temperatures slowly cooled by an average about 1.3 degrees F until the past century when it abruptly warmed 1.3 degrees F. By solar forcing alone, the cooling trend should have continued. The only variable that accounts for the recent feverish spike is our love of fossil fuels and massive levels of carbon dioxide and other greenhouse gases produced by all that combustion.
Ice and rising global temperatures do not mix. This paper in Geophysical Research Letters documents the death spiral of glacial ice in the Canadian Arctic Archipelago (CAA). Before discussing the paper, let me give you a little background.
The CAA consists of 94 major islands and over 36,000 smaller islands, together about 870,000 square miles of land mass. The largest of the islands (Baffin, Devon, Ellesmere, Axel Heiberg) are home to the third largest amount of glacial ice outside of the Greenland and Antarctic ice sheets.
Two years ago, an international team of researchers used satellite-based measurements to document the decline in CAA ice mass between 2004 and 2009. Their paper in Nature showed that the CAA lost an average of 61 billion tons of ice per year over a 6 year period. This pattern of melting also contributed to an annual increase in sea level of 0.17 ± 0.02 mm. Here is the abstract from the paper by Alex Gardner and colleagues.
Mountain glaciers and ice caps are contributing significantly to present rates of sea level rise and will continue to do so over the next century and beyond. The Canadian Arctic Archipelago, located off the northwestern shore of Greenland, contains one-third of the global volume of land ice outside the ice sheets, but its contribution to sea-level change remains largely unknown. Here we show that the Canadian Arctic Archipelago has recently lost 61 ± 7 gigatonnes per year (Gt yr) of ice, contributing 0.17 ± 0.02 mm yr to sea-level rise. Our estimates are of regional mass changes for the ice caps and glaciers of the Canadian Arctic Archipelago referring to the years 2004 to 2009 and are based on three independent approaches: surface mass-budget modelling plus an estimate of ice discharge (SMB+D), repeat satellite laser altimetry (ICESat) and repeat satellite gravimetry (GRACE). All three approaches show consistent and large mass-loss estimates. Between the periods 2004–2006 and 2007–2009, the rate of mass loss sharply increased from 31 ± 8 Gt yr to 92 ± 12 Gt yr in direct response to warmer summer temperatures, to which rates of ice loss are highly sensitive (64 ± 14 Gt yr per 1 K increase). The duration of the study is too short to establish a long-term trend, but for 2007–2009, the increase in the rate of mass loss makes the Canadian Arctic Archipelago the single largest contributor to eustatic sea-level rise outside Greenland and Antarctica.
Nature (19 May 2011): Vol. 473, pp. 357–360
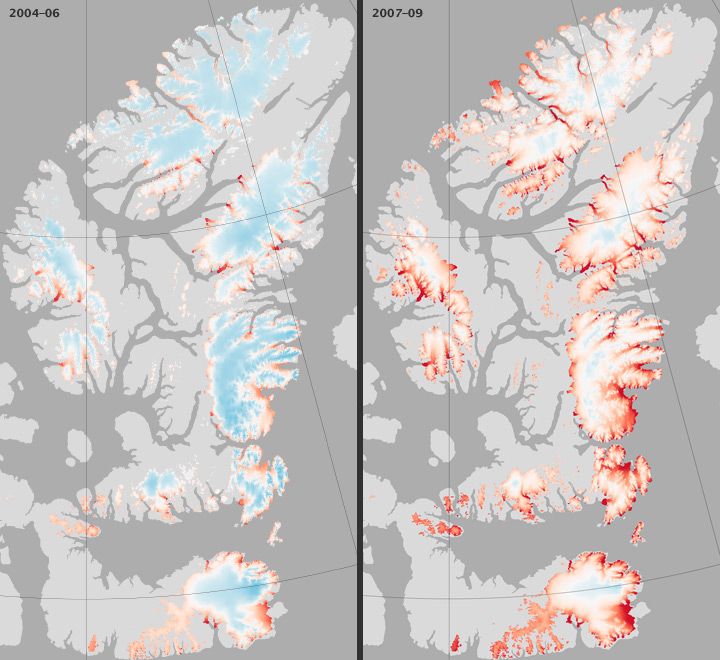
The
following snapshot from NASA provides a look at the changes in one area of the CAA. The left frame shows some mass increase at higher elevations from snow offset by mass loss at lower elevations from melt and runoff during 2004-2006. The right frame shows rapid mass loss across nearly all of the surface between 2007-2009.

The paper by Jan Lenaerts and colleagues in Geophysical Research Letters is the next step. They created a model that closely fit ice mass changes in CAA with all major forcing variables and examined long-term trends. The model was then applied to predict ice loss through the year 2100. Of 7000 likely emissions and temperature simulations, nearly all show rapid melt accounting for at least 20% of the region's glacial mass by the end of century. These changes are not likely to be reversible any time soon. They also found that expected sea level changes from this melt will be double the estimate reported in the Nature study (0.35 ± 0.14 mm yr).
The Canadian Arctic Archipelago (CAA) contains the largest volume of glacier ice on Earth outside of Antarctica and Greenland. In the absence of significant calving, CAA glacier mass balance is governed by the difference between surface snow accumulation and meltwater runoff—surface mass balance. Here we use a coupled atmosphere/snow model to simulate present-day and 21st century CAA glacier surface mass balance. Through comparison with Gravity Recovery and Climate Experiment mass anomalies and in situ observations, we show that the model is capable of representing present-day CAA glacier mass loss, as well as the dynamics of the seasonal snow cover on the CAA tundra. Next, we force this model until 2100 with a moderate climate warming scenario (AR5 RCP4.5). We show that enhanced meltwater runoff from CAA glaciers is not sufficiently compensated by increased snowfall. Extrapolation of these results toward an AR5 multimodel ensemble results in sustained 21st century CAA glacier mass loss in the vast majority (>99%) of the ~7000 temperature realizations.
Geophysical Research Letters, 7 MAR 2013
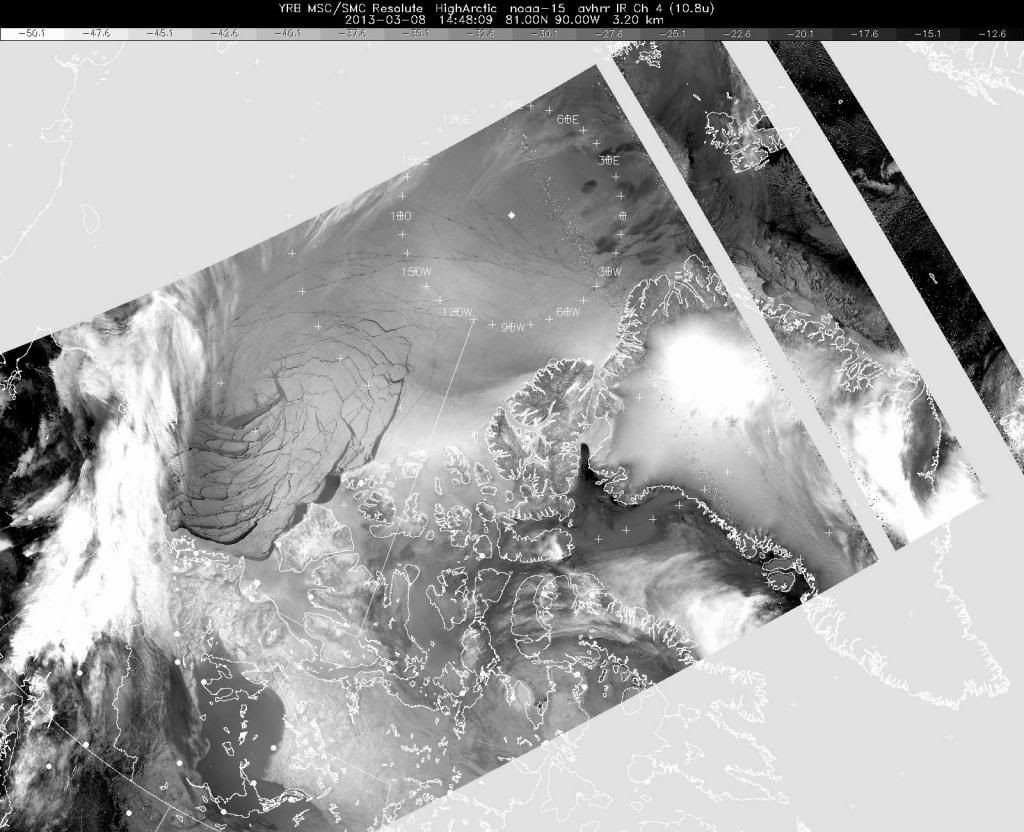
There are also remarkable changes taking place in sea ice north of the CAA. Thanks to negative Arctic Oscillation, warm air has been funneled to the Arctic and keep temperatures in the region far above normal. As a result, fracturing is being observed in the sea ice. Here is a description of the event from the
National Snow & Ice Center.
During the last couple of weeks of February, a broad area of sea ice has fractured off the coast of Alaska and Canada, extending from Ellesmere Island in the Canadian Arctic to Barrow, Alaska. This fracturing event appears to be related to a storm that passed over the North Pole on February 8, 2013, creating strong off-shore ice motion. The large area of fractured ice is located in predominantly first-year ice, which is thinner and easier to fracture than thick, multiyear ice. Similar patterns were observed in early 2011 and 2008, but the 2013 fracturing is quite extensive.
Courtesy of rovertheoctopus, here is a satellite image of the fracturing released by the Weather Office of Canada on March 8, 2013. Note the large swirl of broken ice north to northwest of the CAA and Greenland.
It has been a bad week for climate news. Carbon dioxide levels rose faster than ever last year, thanks to ethically bankrupt corporations and politicians. We also learned that the State Department used consultants with close ties to the oil industry to prepare its Supplementary Environmental Impact Assessment for the Keystone XL pipeline. That selection and conclusions mean that ramping up Canadian tar sands production will likely be a major component of US energy policy for the foreseeable future. Damn the carbon pollution, full speed ahead.
|
Help Us Spread the Word About Climate Change

For those of you on Facebook and Twitter: Please help to spread the word by hitting the FB and Tweet links at the top of this diary and if you have time, join the discussion with comments. Share such postings with friends, family, co-workers, and acquaintances.
Thanks, as all of this helps build the Climate Change movement as well as introducing critically important ideas about renewable sources of energy.
|
